
Figures & data
Table 1. Diagnostic characteristics of combinations of genes tested.
Figure 1. Multiple regression and ROC analysis: (a) ROC curve for the probability score of average methylation levels of differentially methylated CpGs in IGF2-H19 DMR, IG-DMR, ZAC, KvDMR, and PEG3 for the samples analysed in the previous study. Arrow indicates the threshold value of 0.61 probability score. Scatter plot with median for the probability score for the control (N = 73) and RPL samples (N = 80) in the previous study (b) and for the probability score for the control (N = 38) and RPL (N = 45) samples in the current validation study (c). The horizontal line indicates the threshold value of 0.61.
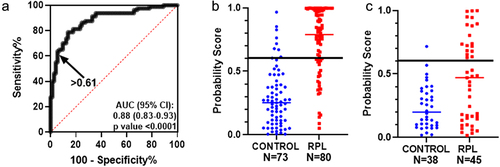
Table 2. Unsupervised k-means clustering of predicted probability values of combination of five imprinted genes into two clusters in validation cohort. Cluster 1 comprised of most of the control samples and some RPL samples with predicted probability values comparable to control; while Cluster 2 comprised of a sub-set of RPL samples with a predicted probability value different than the controls.
Supplemental Material
Download Zip (21.7 KB)Data availability statement
All the data contained in the manuscript can be available on request.