
Figures & data
Figure 1. Graphical summary. Genetic variation in the trans-meQTL hotspot, meQTL.5a (black and pale-brown represent the genotype variants of meQTL.5a), influences CpG methylation at multiple developmental genes. DD in meQTL.5a is associated with higher methylation in the downstream targets. As these CpGs also gain methylation with aging, the DD genotype has a more “aged methylome.” The variation in methylation could contribute to genotype-dependent variation in lifespan. (Emojis downloaded from https://dryicons.com).
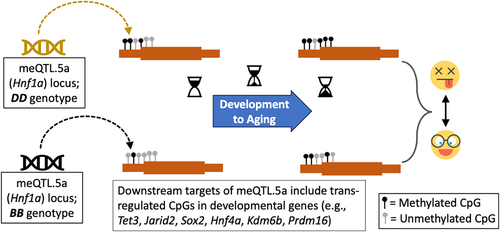
Figure 2. Overview of methylation QTL (meQTLs) in the liver. (a) plot of the genome-wide peak LOD score for the 27,966 CpGs, and distance between the CpG and the maximum LOD marker. Yellow: D allele (DBA/2J genotype) has positive additive effect; blue: B allele (C57BL/6J genotype) has positive additive effect. (b) meQTL location (x-axis; from chromosomes 1–19) and counts of meQTLs with LOD ≥ 3.5. (c) the genome graph plots location of the genome-wide peak QTL marker (x-axis), and location of the linked CpG (y-axis). Shows only the 3921 CpGs that map at LOD ≥ 3.5. Relative enrichment or depletion in (d) genomic location, and (e) predicted chromatin states for CpGs that map as cis-meQTLs (black), and as trans-meQTLs (grey). Asterisks denote hypergeometric enrichment p < 0.001. (f) enrichment or depletion in differentially methylated CpGs among the cis- and trans-modulated CpGs. (Asterisks denote hypergeometric enrichment p < 0.001; hash denotes p = 0.003) (g) Portion of the peak interval in the chromosome 5 meQTL hotspot: meQTL.5a (from UCSC Genome browser GRCm38/mm10).
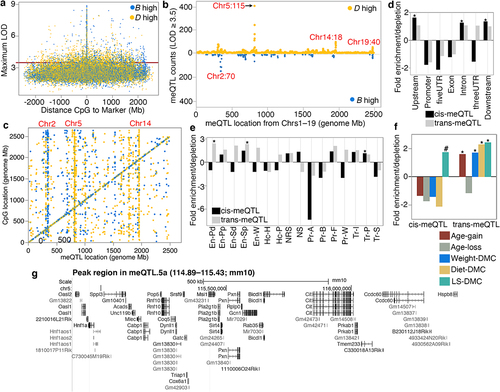
Table 1. Liver meQTL hotspots.
Figure 3. Genetics of co-methylation CpG networks. QTL maps for four module eigengenes (MEs) are shown. Mapping was done using a linear mix model. The horizontal dashed red line marks a relatively lenient threshold of –log10p = 3.5. The Blue, black and Lightgreen modules share suggestive overlapping QTLs in meQtl.5a. Eaa19 has a strong cis-regulatory effect on the Royalblue module. The chromosome 2 peak for the black module is proximal to meQTL.2b in .
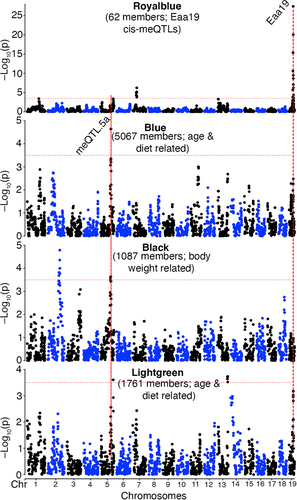
Figure 4. Enriched functional pathways genomic regions enrichment analysis of (a) CpGs that are trans-modulated by meQTL.5a, and (b) CpGs that are members of the Blue module. Gene ontology and pathway enrichment among (c) transcripts, and (d) proteins that map to meQTL.5a in liver.
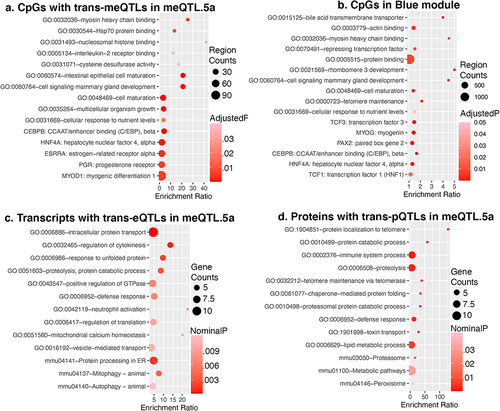
Table 2. Candidate genes in meQtl.5a.
Figure 5. Interaction networks that connect the trans-meQTLs to the candidate genes in meQTL.5a. (a) the trans-modulated CpGs and candidate genes in meQTL.5a form a highly connected and functionally enriched protein–protein interaction network. HNF1A (yellow triangle) is the most connected candidate in the central sub-network, and member of the enriched MODY (maturity onset diabetes of the young) pathway (red nodes). (b) CREBBP is the hub gene in the meQTL-based network, and a CpG in its exon is trans-modulated by meQtl.5a (top). Its mRNA (bottom of mirrored Manhattan plot) has a weak peak in meQTL.5a. Crebbp is located on chromosome 16 (red triangle). (c) the CpG in the 5’UTR of Hnf1a is cis-modulated, and its expression has a weak cis-eQTL. Strong positive correlation between the CpGs (d), and between the mRNAs (e) of Hnf1a and Crebbp. Weak inverse correlation between (f) the Hnf1a mRNA and Crebbp methylation, and (g) between the mRNA and methylation of Hnf1a.
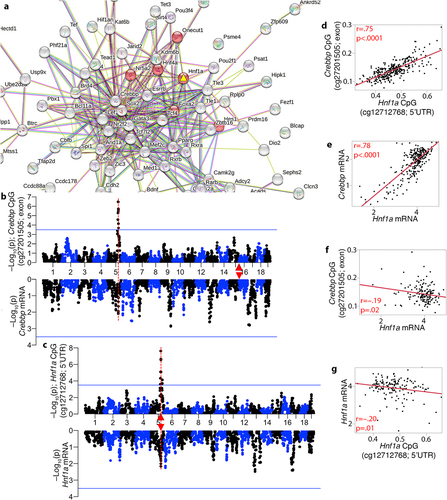
Figure 6. Primary protein–protein interaction partners of HNF1A and their trans-modulation (a) the network shows the top 10 interaction partners of HNF1A based on protein–protein interactions. CpGs in CREBBP, FOXA2 (HNF3B), GATA4, HNF4A, ONECUT1, and PCBD2 are trans-modulated by the meQTL.5a locus, making Hnf1a a prime candidate. (b) at the transcriptomic level, expression of these genes in the liver are also highly intercorrelated. Only correlations |r| > 0.45 are shown (line thickness conveys strength of correlation; blue: negative; red: positive). Mirrored meQTL (top), and eQTL (bottom) for two example gene: (c) Foxa2, and (d) Gata4. Red triangles mark the location of genes.
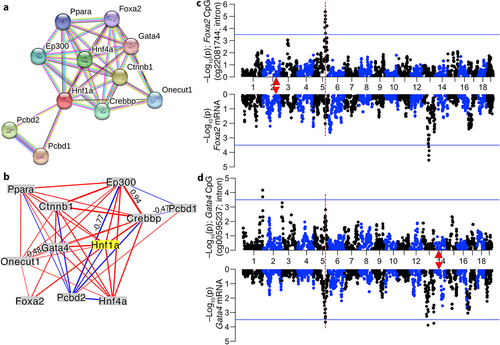
Figure 7. Joint modulation of CpGs by genetic and non-genetic variables (a) CpGs with trans-meQTLs in meQTL.5a are enriched in differentially methylated CpGs (DMCs) associated with aging, diet, and body weight. Asterisks denote hypergeometric enrichment p ≤ 0.001; hash denotes p = 0.006. (b) trans-CpGs that are increased in methylation by the D allele in meQTL.5a gain methylation with age (positive regression estimate on the y-axis) while those with higher methylation for the B allele lose methylation with age. Dashed red horizontal line indicate Bonferroni p ≤ 0.05 for DMC. (c) CpG in the Jarid2 5’UTR gains methylation with age and has higher methylation in BXDs with the DD genotype in meQTL.5a. (d) QTL plots for the Jarid2 CpG (top Manhattan plot), and mRNA (bottom). Red triangle marks the location of Jarid2. (e) allele dependent increase in methylation at the meQTL.5a trans-CpGs due to HFD. (f) allele dependent association with body weight for the trans-CpGs. (g) Overall mean methylation of the trans-modulated CpG is higher for BXDs with DD genotype in meQTL.5a for both control diet (CD; 0.35 ± 0.02 for BB; 0.38 ± 0.03 for DD; pair-wise p < 0.0001) and high fat diet (HFD; 0.36 ± 0.03 for BB; 0.38 ± 0.03 for DD pair-wise p < 0.005). (h) allele dependent increase in mean methylation for the CpGs with trans-meQTL in meQTL.5a. (i) body weight is slightly higher for BXDs with BB in meQTL.5a for both CD (27 ± 6 g for BB; 26 ± 5 g for DD; pair-wise p < 0.1) and HFD (47 ± 13 g for BB; 42 ± 13 g for DD; pair-wise p < 0.02).
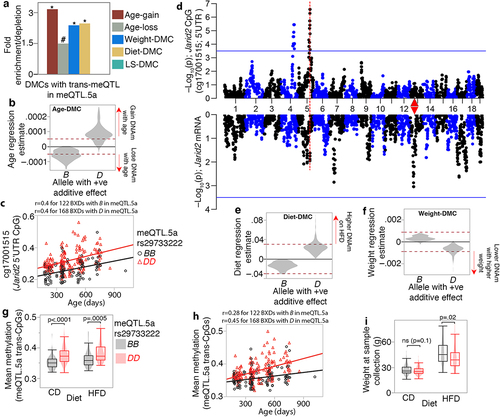
Table 3. Multivariable regressions for mean methylation and weight.
Figure 8. Pleiotropic influence on meQTL.5a on body weight at young age and lifespan (a) body weight at 6 months (mos) from a separate cohort of BXD mice show higher mean weight for strains with BB genotype in meQTL.5a for control diet (CD; 26 ± 6 g for BB; 25 ± 5 g for DD; pair-wise p < 0.004) and high fat (HFD; 34 ± 9 g for BB; 31 ± 8 g for DD; pair-wise p < 0.0001). Samples numbers: 383 BB and 503 DD for CD; 392 BB and 457 DD for HFD. (b) Kaplan-Meir survival plots by genotype at meQTL.5a for CD mice (399 BB and 510 DD). Median lifespan in days (MedianLS) for the genotypes shown (log-rank p = 0.008). (c) similar survival plot for HFD shows no significant difference between genotypes (402 BB and 462 DD). (d) Kaplan-Meir survival after adjusting lifespan for 6 mos weight. Adjusted median lifespan in days shown for each genotype-by-diet below the graph. Within each diet, the BB genotype has longer lifespan compared to DD (based on pairwise comparison, log-rank p < 0.0001 for CD, and p = 0.03 for HFD). (e) model depicting horizontal pleiotropic influence on CpG methylation and weight, and vertical pleiotropic influence on lifespan mediated by CpG, which are also under the influence of ageing and diet.
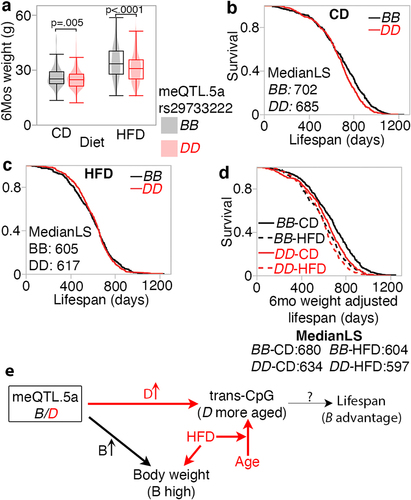
Table 4. Multivariable regressions for body weight at 6 months of age and strain lifespan.
Table 5. Phenotypes that map to meQtl.5a.
Supplemental Material
Download Zip (32.6 MB)Supplemental Material
Download Zip (35.5 MB)Data availability statement
The data used in this study are available from NCBI Gene Expression Omnibus (GEO accession ID GSE199979). Genotype data are provided as Supplemental Data.