
Figures & data
Figure 1. The DNMT1 expression level partially dictates 5-Azacytidine sensitivity in GC cells.
Note: a. The mRNA expression of DNMT1 in seven GC cell lines and immortalized normal epithelial GES-1 cells was detected by RT-PCR. The relative expression of DNMT1 was calculated by normalizing the DNMT1 mRNA level of each cell line to the median DNMT1 mRNA level among the eight cell lines. ACTB served as an internal control. b. The protein expression of DNMT1 in seven GC cell lines and immortalized normal epithelial GES-1 cells was detected by western blotting. α-Tubulin served as an internal reference. c. Dose–response curves of the seven GC cell lines and immortalized normal epithelial GES-1 cells to 5-Azacytidine. d. IC50 value to 5-Azacytidine of seven GC cell lines and immortalized normal epithelial GES-1 cells was evaluated by CCK-8 assay. Data are shown as the mean± SD obtained from three independent experiments. e. BGC-823 cells were transfected with lentivirus expressing shRNA specific for DNMT1 or control siRNA. The IC50 value to 5-Azacytidine of shDNMT1#1 and shControl cells was evaluated. IC50 value of shDNMT#1 cells was normalized to that of the shControl cells. Two-tailed Student’s t-test. *P < 0.05, **P < 0.01, ***P < 0.001. f. MKN-45 cells were transfected with lentivirus expressing shRNA specific for DNMT1 or control shRNA. The IC50 value to 5-Azacytidine of shDNMT1#1 and shControl cells was evaluated. IC50 value of shDNMT#1 cells was normalized to that of the shControl cells. Two-tailed Student’s t-test. *P < 0.05, **P < 0.01, ***P < 0.001.
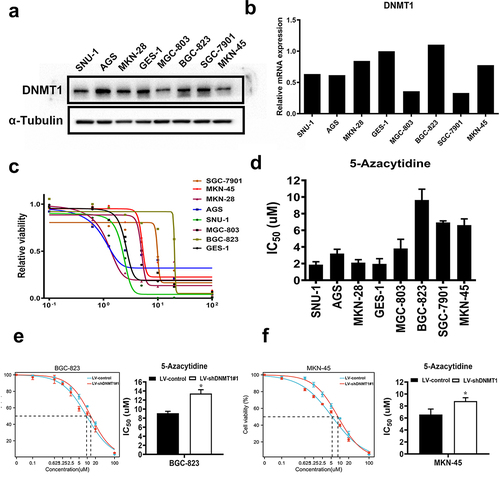
Figure 2. MEK/ERK inhibition led to decreased DNMT1 expression in GC cells.
Note: a. b. BGC-823 and AGS cells were treated with DMSO and 0.1uM and 1uM Selumetinib for 24 hours, respectively. Then, the protein levels of total Erk1/2, p-Erk1/2, and DNMT1 were detected by western blotting. α-Tubulin served as an internal reference. c. d. BGC-823 and MKN-45 cells were starved of serum for 12 hours and then stimulated with saline or EGF (100 ng/ml) for 24 hours. Then, the expression levels of DNMT1 were detected by RT-PCR and western blotting, respectively. ACTB or α-tubulin served as an internal reference. The relative level of DNMT1 mRNA was normalized by that of saline-treated cells. The level of DNMT1 in EGF-treated cells was compared to that of the saline-treated cells. Two-tailed Student’s t-test. *P < 0.05, **P < 0.01, ***P < 0.001. e. AGS cells were transfected with siRNAs specific for KRAS (siKRAS1#1 or siKRAS#2) or control siRNA (siScrambled) for 48 hours. Then, western blotting was performed to validate the knockdown efficiency. α-Tubulin served as an internal reference. f. AGS was transfected with siRNA specific for KRAS (siKRAS#1 or siKRAS#2) or control siRNA (siScrambled), respectively. The protein level of ERK1/2, p-ERK1/2, and DNMT1 was detected by western blotting. α-Tubulin served as an internal reference.
Figure 3. 5-Azacytidine treatment led to significant decline of DNMT1 and DNMT3A protein levels in GC cells.
Note: a. b. AGS and BGC-823 cells were treated with DMSO, 1uM 5-Azacytidine, and 10uM 5-Azacytidine for 48 hours, and protein was extracted. Then, western blotting was performed to detect the protein levels of DNMT1, DNMT3A, and DNMT3B. α-Tubulin served as an internal reference. c. d. AGS and BGC-823 cells were treated with DMSO, 1uM 5-Azacytidine, and 10uM 5-Azacytidine for 48 hours, and RNA was extracted. RT-PCR was performed to detect the mRNA levels of DNMT1, DNMT3A, and DNMT3B. ACTB served as an internal reference. The relative mRNA levels were normalized to that of DMSO-treated cells. Two-tailed Student’s t-test. *P < 0.05, **P < 0.01, ***P < 0.001. n.s., not significant.
Figure 4. 5-Azacytidine pre-treatment led to increased activity of the MEK/ERK pathway in GC cells.
Note: a. BGC-823 cells were treated with DMSO, 0.1uM, 1uM, and 10uM 5-Azacytidine for 24 hours. Western blot was performed to detect the phosphorylation and total level of MEK1/2 and Erk1/2. α-Tubulin was served as an internal reference. b. AGS cells were treated with DMSO, 0.1uM, 1uM, and 10uM 5-Azacytidine for 24 hours. Western blot was performed to detect the phosphorylation and total level of MEK1/2 and Erk1/2. α-Tubulin was served as an internal reference. c. CCK-8 assay was performed in BGC-823 cells to evaluate the effect of sequential treatment with 5-Azacytidine and Selumetinib on cell proliferation. The effect of drugs on cell proliferation was calculated as percentage growth of cells relative to DMSO-treated cells. d. LDH assay was performed in BGC-823 cells to evaluate the effect of sequential treatment with 5-Azacytidine and Selumetinib on cell proliferation. The effect of drugs on cell proliferation was calculated as percentage growth of cells relative to DMSO-treated cells. e. CCK-8 assay was performed in AGS cells to evaluate the effect of sequential treatment with 5-Azacytidine and Selumetinib on cell proliferation. The effect of drugs on cell proliferation was calculated as percentage growth of cells relative to DMSO-treated cells. f. LDH assay was performed in AGS cells to evaluate the effect of sequential treatment with 5-Azacytidine and Selumetinib on cell proliferation. The effect of drugs on cell proliferation was calculated as percentage growth of cells relative to DMSO-treated cells.
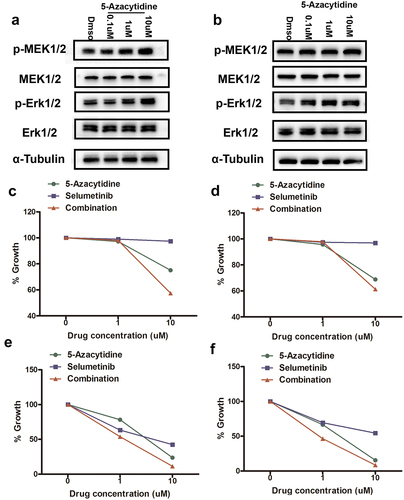
Table 1. Combinational index (CI) value for sequential treatment with 5-Azacytidine and Selumetinib in AGS and BGC-823 cells. CI value: <1 synergistic; = 1 Additive; and > 1 Antagonistic.
Figure 5. DNMT1 expression was correlated with RAS/MEK/ERK activity in GC.
Note: a. Correlation between DNMT1 expression level and ETS1, E2F1, or CCND1 expression level in TCGA GC samples was analysed in GEPIA database (http://gepia.cancer-pku.cn/). b. Western blotting analysis of p-Erk1/2 level and DNMT1 expression level in seven GC cells and immortalized epithelial GES-1 cells. α-Tubulin served as an internal reference. c. Correlation analysis of RAS-dependent gene signature with DNMT1 expression level (mRNA sequencing) was performed in TCGA GC samples using the Pearson correlation method. Gene list of RAS-dependent gene expression signature was consisted of EGR1, DUSP6, FOSL1, ETV1, ETV4, ETV5, and SPRY-4.
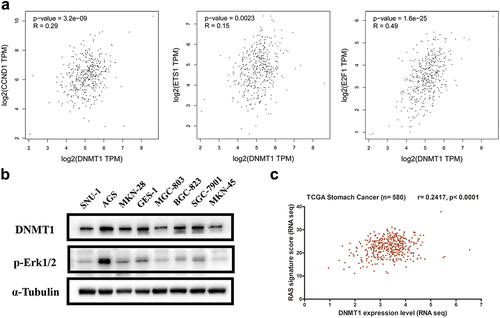
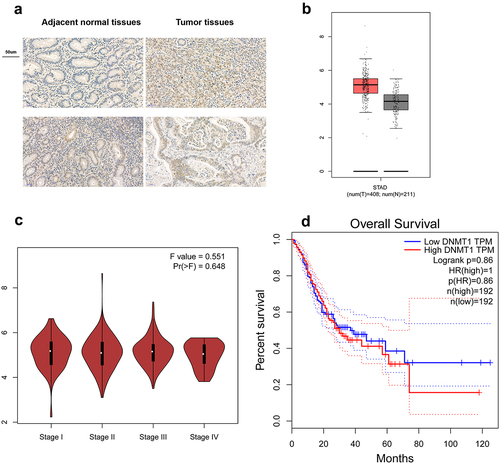
Figure 6. DNMT1 was up-regulated in GC tumour tissues compared with adjacent normal tissues.
Note: a.The expression of DNMT1 in GC tumour tissues and their paired adjacent normal tissues was analysed by IHC. Representative pictures of DNMT1 expression in tumour tissues and adjacent normal tissues. Scale bar = 50uM. b. The expression of DNMT1 in GC tumour tissues and normal tissues was analysed in GEPIA database (http://gepia.cancer-pku.cn/). c. The expression of DNMT1 in GC tumour tissues of different stages was analysed in GEPIA database. d. Kaplan–Meier analysis of overall survival rate of TCGA GC patients with high and low DNMT1 expression in GEPIA database.
Supplemental material