
Figures & data
Figure 1. MiR-195-5p inhibits ATG9A translation. (a) targetscan, mirwalk, and starbase predicted 746–756 as the binding site of ATG9A and miR-195-5p. (b) wild type (WT) and mutant (MUT) ATG9A 3‘‑UTR luciferase reporter plasmids were constructed. (c,d) After transfection, luciferase activity was compared by double luciferase reporter assay. (e,f) miR-195-5p levels in HeLa and SiHa cells transfected with the mimics and inhibitor for 24 h. (g,h) After increasing or inhibiting the expression of miR-195-5p, expression of ATG9A was determined by western blotting (i,j) or qRT-PCR (k,l). Quantification is shown in the bar graph. Experiments were repeated three times (n = 3). Student’s t-tests were used for statistical analyses. *p < 0.05, **p < 0.01, and ***p < 0.001 versus control groups.
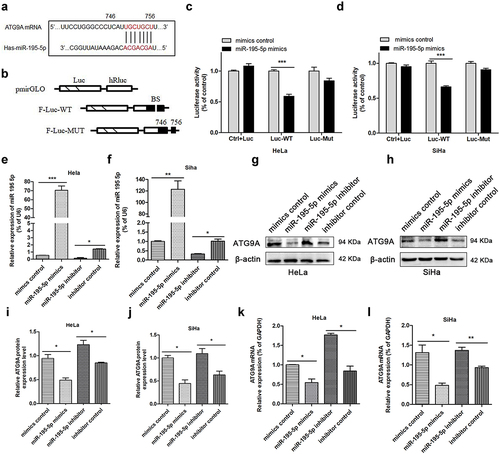
Figure 2. Upregulation of miR-195-5p represses EMT in CC cells. (a,b) western blotting showed that upregulation of miR-195-5p enhanced the expression levels of E-cadherin and decreased the expression levels of Snail, Vimentin, MMP-2, MMP-9, and VEGFA in HeLa and SiHa cells, respectively. Downregulation had opposite effects. β-actin was used as an internal control. Experiments were repeated three times (n = 3). Student’s t-tests were used as statistical analyses. *p < 0.05, **p < 0.01, and ***p < 0.001 versus control groups.
Figure 3. Overexpression of miR-195-5p induces apoptosis and autophagy of CC cells. HeLa and SiHa cells were transfected with mimics or inhibitor and negative control for 48 h. (a,b) TUNEL assay of fluorescence images of each group in HeLa and SiHa cells (scale bar, 100 μm). TUNEL staining analysis was used to detect apoptosis after transfection. The percentage of TUNEL-positive cells in each group is shown in the bar graph. (c,d) expression of Caspase-3, Bcl-2, and Bax measured by western blotting. (e,f) expression of LC3-II and P62 by western blotting. Data are expressed as mean ± SD. *p < 0.05, **p < 0.01, and ***p < 0.001 versus control group.
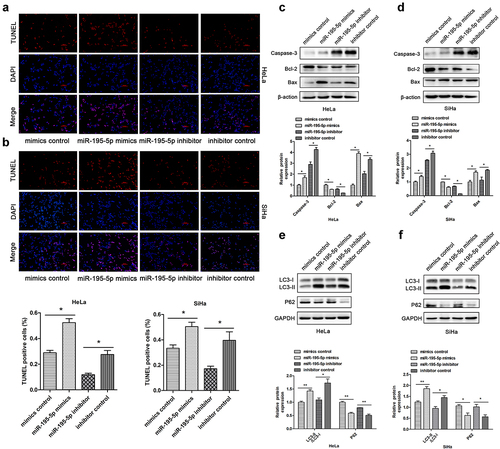
Figure 4. Upregulation of ATG9A partially overturned the effects of miR-195-5p on proliferation, migration, and invasiveness of CC cells. HeLa and SiHa cells were transfected with negative control, mimics + ATG9A NC, and mimics + ATG9A. (a,b) MTT assay was used to assess HeLa and SiHa cell proliferation. (c,d) wound healing assay was used to assess migration of CC cells following transfection (magnification, ×100). (e,f) Transwell assay (magnification, ×100) was performed to check invasiveness of CC cells. Experiments were repeated three times (n = 3) and quantification is shown in the bar graph. Student’s t-tests were used for statistical analyses. *p < 0.05, **p < 0.01, and ***p < 0.001 versus control group.
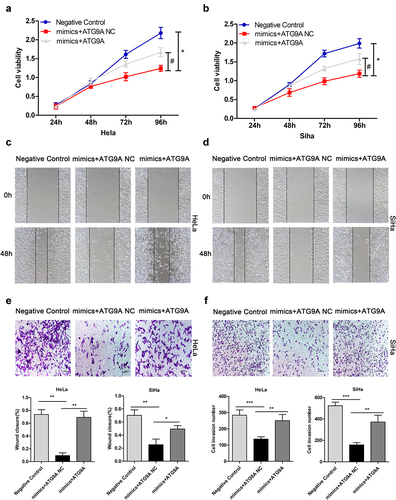
Figure 5. Overexpression of ATG9A partially rescued miR-195-5p-mediated inhibition of EMT. (a,b) western blotting was used to determine expression of ATG9A, E-cadherin, Vimentin, Snail, MMP-2, MMP-9, and VEGFA. Experiments were repeated three times (n = 3) and quantification is shown in the bar graph. Student’s t-tests were used for statistical analyses. *p < 0.05 and **p < 0.01 versus control group.
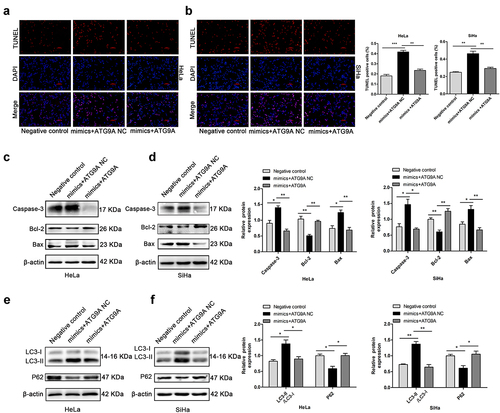
Figure 6. MiR-195-5p induces apoptosis and autophagy of CC cells by inhibiting ATG9A. (a,b) TUNEL assay (magnification, ×100) was performed after transfection with negative control, mimics + ATG9A NC, and mimics + ATG9A. (c,d) expression of Caspase-3, Bcl-2, and Bax measured by western blotting. (e,f) expression of LC3-II and P62 by western blotting. Experiments were repeated three times (n = 3). *p < 0.05 and **p < 0.01 versus control group.
Data availability statement
All supporting data are included within the main article.