
Figures & data
Figure 1. METTL3 was down-regulated in CAFs. CAFs were separated from NSCLC tissues, and NFs were separated from para-carcinoma tissues. a, the morphology of CAFs and NFs was identified by IF. Scale bar = 100 μm. b, the level of METTL3, METTL16, METTL14, WTAP, FTO and ALKBH5 were analysed by TCGA database. c, m6A writers’ levels, including METTL14, METTL3, WTAP, METTL16, FTO and ALKBH5 were detected by qRT-PCR. d, m6A writers’ levels, including METTL14, METTL3, WTAP, FTO, ALKBH5 and METTL16 were detected by Western blot. e, histopathological feature of NSCLC tissues and para-carcinoma tissues was evaluated by H&E staining. Scale bar = 50 μm. f, METTL3 level in NSCLC tissues and para-carcinoma tissues was analysed by IHC. Scale bar = 50 μm. g, α-SMA and METTL3 level in CAFs and NFs. h, IL-18 expression in CAFs and tumour cells of NSCLC was detected. All data were shown as mean ± SD. n = 3 per group. *P < 0.05, **P < 0.01, ***P < 0.001.
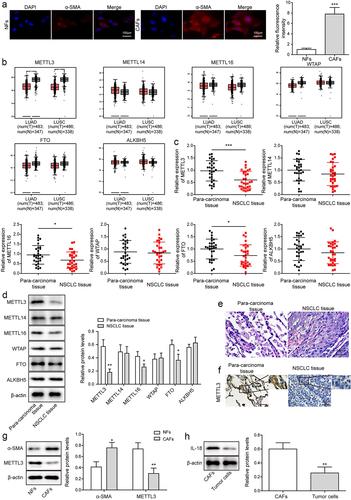
Table 1. Primer sequences.
Figure 2. CAF derived METTL3 alleviated PD-L1-mediated immunosuppression of NSCLC through IL-18. CAFs were transfected with sh-METTL3 or oe-METTL3, CAFs that transfected with sh-NC or oe-NC served as the negative control. a-b, the levels of METTL3 and IL-18 in CAFs were detected by qRT-PCR and Western blot. c, the levels of IL-18 in CM from CAFs were detected by ELISA. d-e, PD-L1 levels in A549 and H1650 cells were assessed by Western blot and FCM. f, the levels of granzyme B and perforin in CD8+ T cells were detected by ELISA. g, the cytotoxicity of CD8+ T cells was detected by using LDH kit. All data were shown as mean ± SD. n = 3 per group. *P < 0.05, **P < 0.01, ***P < 0.001.
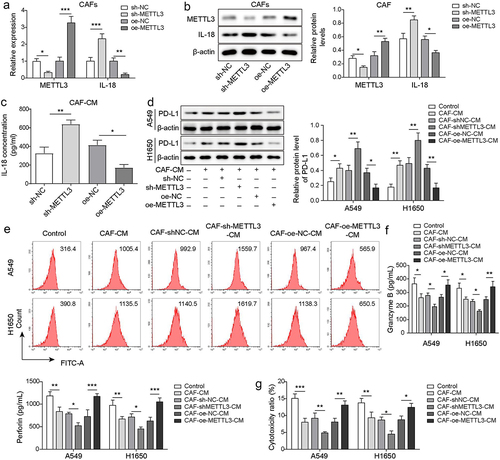
Figure 3. IL-18 was a directly target of METTL3. a, IL-18 mRNA level was detected by qRT-PCR. b, correlation analysis of METTL3 and IL-18 in NSCLC tissues. c, RNA m6A dot blot assay was carried to detect the level of RNA m6A. d, the m6A motif sites of METTL3 coding region were predicted by RMBase v2.0 website. e, MeRIP-qPCR was carried to assess the level of IL-18 m6A. f, the direct binding relationship between METTL3 and IL-18 was confirmed by dual-luciferase reporter assay. g, IL-18 mRNA level was detected by qRT-PCR following METTL3 overexpression and actinomycin D treatment. h, the combination of YTHDF2 and IL-18 mRNA was detected by RIP assay. i, the combination of YTHDF2 and IL-18 mRNA was confirmed by RNA pulldown. CAFs were transfected with sh-YTHDF2, CAFs that transfected with sh-NC were served as the negative control. j, YTHDF2 level was detected by RT-qPCR. k, the level of YTHDF2 and IL-18 was measured by Western blot. l, the level of IL-18 was detected by ELISA. m, YTHDF2 knockdown-CAFs were treated with actinomycin D, and the degradation of IL-18 mRNA was evaluated by qRT-PCR. METTL3 overexpressed-CAFs were furtherly transfected with sh-YTHDF2. n, IL-18 was measured by Western blot. o, the level of IL-18 was detected by ELISA. All data were shown as mean ± SD. n = 3 per group. *P < 0.01, **P < 0.01, ***P < 0.001.
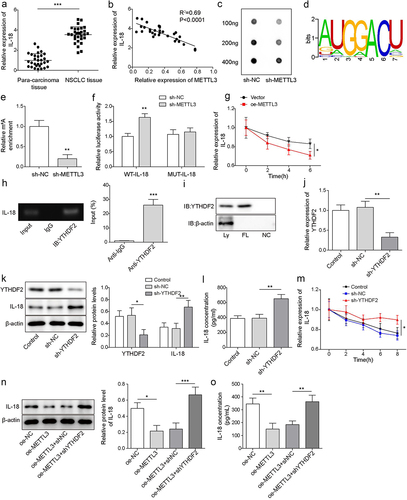
Figure 4. IL-18 was main effector of CAF-derived METTL3 against immunosuppression of NSCLC. a-b, IL-18 level was detected by qRT-PCR and Western blot. c-d, PD-L1 level was assessed by Western blot and FCM. e, the levels of granzyme B and perforin were detected by ELISA. F, the cytotoxicity of CD8+ T cells was detected by using LDH kit. All data were shown as mean ± SD. n = 3 per group. *P < 0.05, **P < 0.01, ***P < 0.001.
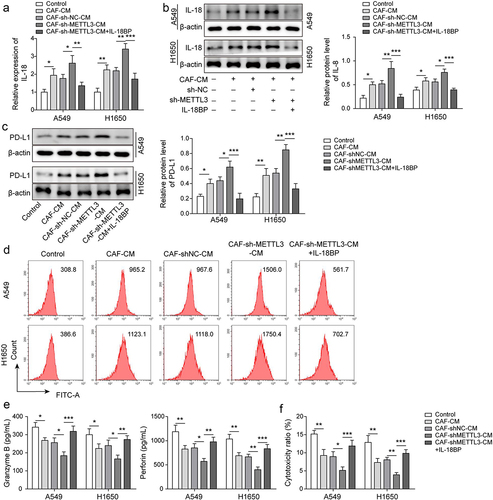
Figure 5. IL-18 accelerated immunosuppression of NSCLC by driving NF-κB pathway. A-B, IL-18 level was detected by qRT-PCR and Western blot. C, NF-κB pathway related proteins’ expression was measured by Western blot. D-E, PD-L1 level was assessed by Western blot and FCM. F, the levels of granzyme B and perforin were detected by ELISA. G, the cytotoxicity of CD8+ T cells was detected by using LDH kit. All data were shown as mean ± SD. n = 3 per group. *P < 0.05, **P < 0.01, ***P < 0.001.
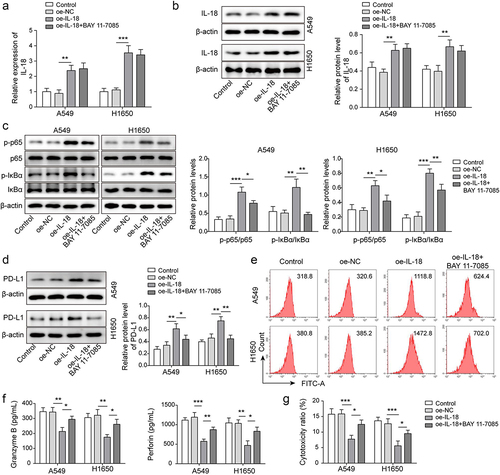
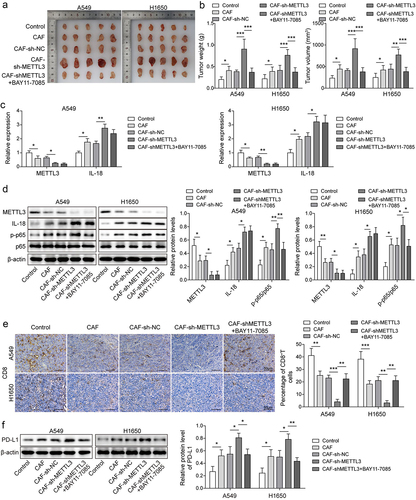
Figure 6. The down-regulation of CAF derived METTL3 accelerated immunosuppression of NSCL. a-b, Statistical analysis of tumour volume and weight of NSCLC mice. c, the levels of METTL3 and IL-18 were detected by qRT-PCR. d, the levels of METTL3, IL-18, p65 and p-p65 were detected by Western blot. e, the distribution of CD8 was detected by IHC, Scale bar = 50 μm. f, the PD-L1 expression status in tumours by western blot. All data were shown as mean ± SD. n = 5 per group. *P < 0.05, **P < 0.01, ***P < 0.001.
Supplemental Material
Download Zip (416.7 KB)Data availability statement
The raw data supporting the conclusions of this manuscript will be made available by the authors, without undue reservation, to any qualified researcher.