Figures & data
Figure 1. Reliability of HPLC chromatogram to evaluate the ASNS gene methylation status in BCP-ALL cell lines and clinical samples. (a) Schematic representation of a CpG island at the boundary between the promoter region and the initial exon of the ASNS gene. Bisulfite PCR was performed in the indicated 247 bp region containing 23 CpG sites. (b) Allele-specific methylation pattern of the ASNS gene in eight representative BCP-ALL cell lines with different methylation status. In each cell line, the left panel indicates the hierarchical clustering heatmap, while the right panel indicates the histogram based on each read of the NGS analysis. In the heatmap, red and blue indicate methylated and unmethylated CpG sites, respectively. In the histogram, percent value represents mean percent ASNS methylation of each NGS read. (c) HPLC chromatograms of eight representative BCP-ALL cell lines with different methylation status. The vertical axis indicates absorbance at 260 nm and the horizontal axis indicates the elution time. The black line indicates the elution curve of each sample, while the red and blue lines indicate the elution curves of fully methylated and fully unmethylated synthesized DNA fragments, respectively. Percentage value represents mean percent ASNS methylation based on the measurements in elution curve. (d) HPLC chromatogram of eight representative BCP-ALL clinical samples with different methylation status. In each sample, the left panel indicates the HPLC chromatogram, while the right panel indicates the histogram of the NGS read. Percentage values represent mean percent ASNS methylation evaluated with the HPLC method (left) and NGS method (right), respectively.
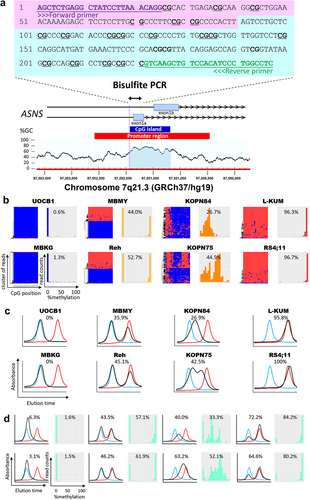
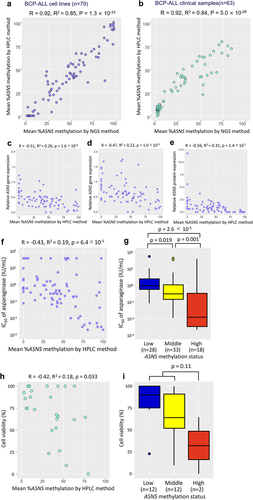
Figure 2. Utility of the ASNS methylation status evaluated with the HPLC chromatogram as a pharmacogenomic biomarker to predict asparaginase sensitivities of BCP-ALL cell lines and clinical samples. (a,b) Correlation of mean percent ASNS methylation evaluated by the HPLC method (vertical axis) with that by NGS method (horizontal axis) in 79 BCP-ALL cell lines (a) and 63 BCP-ALL clinical samples. (b) Correlation coefficients and p-values in Spearman’s rank correlation coefficient are indicated at the top of the panels. (c,d,e) correlations of mean percent ASNS methylation evaluated by the HPLC method with basal (c) and asparaginase-induced (d) ASNS gene expression levels, and ASNS protein expression levels (e). (f,g) correlations of mean percent ASNS methylation evaluated by the HPLC method (f) and association of ASNS gene methylation status (g) with IC50 values of asparaginase in 79 BCP-ALL cell lines. P values in Steel–Dwass post hoc test for Kruskal–Wallis test are indicated on the top. (h,i) correlation of mean percent ASNS methylation (h) and association of ASNS gene methylation status (i) evaluated by the HPLC method with in vitro cell viabilities treated with 0.01 IU/ml of asparaginase for 72 hours in 26 BCP-ALL clinical samples at diagnosis. P values in Mann-Whitney U test are indicated at the top of the figure.