
Figures & data
Figure 1. Construction of ES event prediction model.
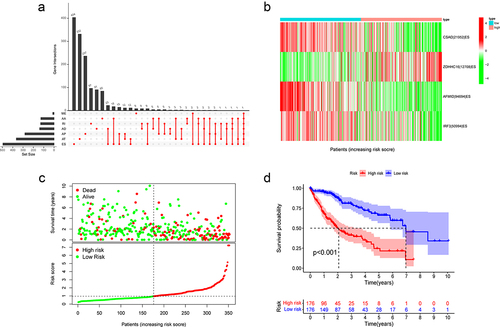
Table 1. The prognostic model related to exon skip events.
Figure 2. The prediction ability and independent verification of the model.
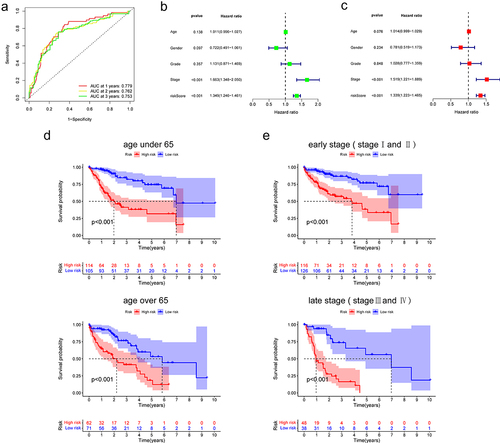
Figure 3. Correlation of model with clinical features.
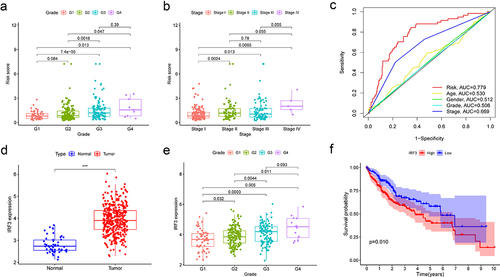
Figure 4. The structure and isoforms of IRF3.
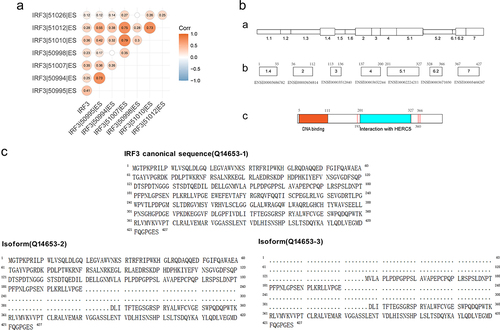
Table 2. The IRF3 ES events associated with prognosis.
Figure 5. Screening and grouping of patients based on the proportion of IRF3 ES events.
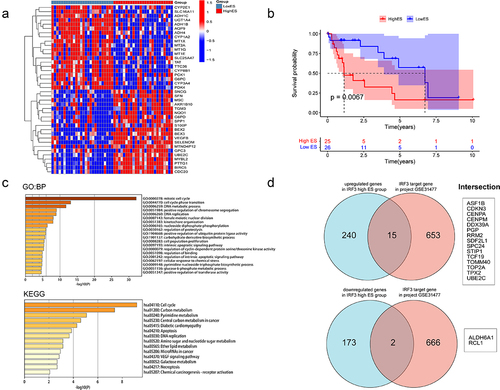
Figure 6. Expression and prognosis of differentially expressed target genes in HCC.
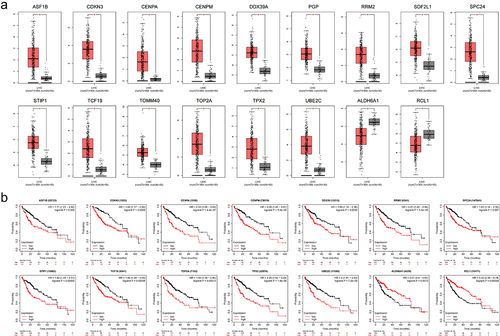
Figure 7. Correlation of IRF3 and its ES events with tumour immune characterization.
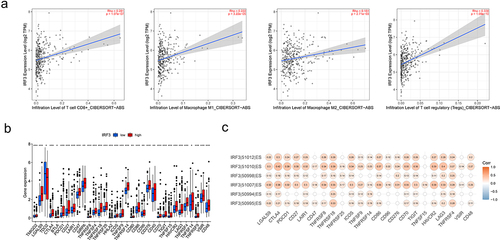
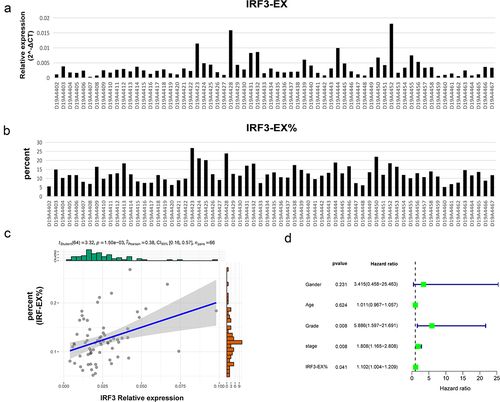
Figure 8. Detection of IRF3 exon skipping by cDNA microarray.
Supplemental Material
Download ()Data availability statement
The original contributions presented in the study are included in the article/Supplementary Material. Further inquiries can be directed to the corresponding authors.