
Figures & data
Figure 1. Changes in MeCP2 during ReNCell differentiation. Western blot analysis of MeCP2 at different DIVs normalized to ß-actin (a) and histone H4 (b). Graph shows mean ± standard error of three independent experiments. DIV: days in vitro, P30 L and P30 B: mouse liver and brain respectively at 30 days after birth.
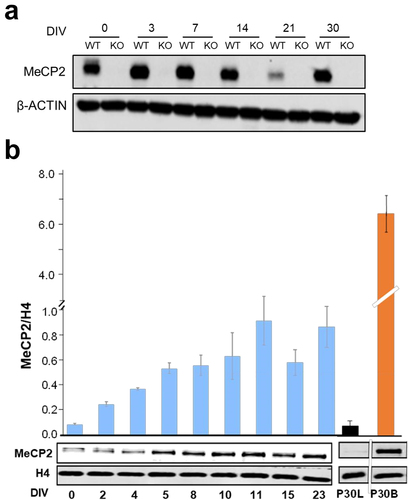
Figure 2. Characterization of WT and KO ReNCell during induced cell differentiation. (a) evolution of NeuN protein expression after several days of induced differentiation (DIV). Histone 4 was used as endogenous control. (b) western blot analyses of MAP2 and GFAP in WT and KO in DIV 0 and 8. Histone H4 was used as endogenous control and the graphs correspond to average of three technical replicates. Error bars represent standard error. (c) changes in cell morphology between WT and KO as progenitors (DIV 0) and after 8 days of differentiation (DIV 8). Cells were stained by SGC5 membrane dye (green); and nuclei by DAPI (blue). Scale bar: 50 µm. (d-e) morphological differences between neurons (MAP2+) in astrocyte (GFAP+) between WT and KO cells as progenitors (DIV 0) and 7-day differentiated cells (DIV 7). MAP2+ cells are represented in cyan and GFAP+ in magenta. Nuclei was stained with DAPI (blue). Scale bars: 50 µm. Percentage of covered area of MAP2+ and GFAP+ in WT and KO (n = 10 per sample) in DIV 7. Error bars represent standard error.
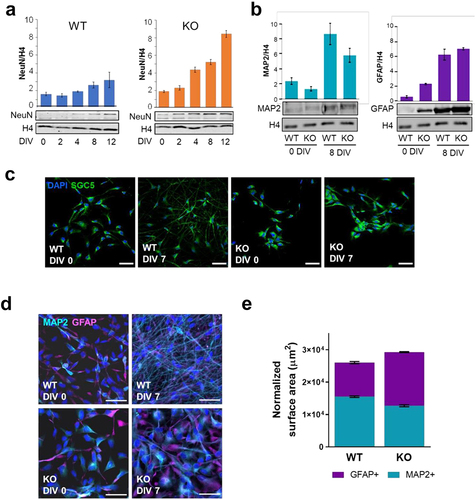
Figure 3. Linker histone composition of ReNCell at 0 and 8 DIV. (a-1) RP-HPLC chromatograms of KO RenCell 8 DIV. Elution fractions (38 to 41) were visualized using Coomassie blue stained SDS-PAGE and western blotting using H1.2, H1.4 and H1.5. The asterisks point to contaminating non-histone proteins arising from the whole-cell nature of the HCl extracts used in the HPLC analyses. (a-2) SDS-PAGE of HCl-extracts from different tissues and ReNCell. CM: chicken erythrocyte marker. The red rectangles highlight the histone H1 region. (b-1-2) Linker histone/core histone ratio calculated by quantifying signals from HPLC chromatograms and Coomassie-stained bands respectively (see Fig.S1 and fig S2). Data represent mean of 3–5 independent experiments ± standard error. Unpaired two-tailed t-tests were used to generate the P-values (HPLC p-values are 0.8369 for DIV 0 and 0.0031 for DIV 8. Coomassie p-values are 0.4506 for DIV 0 and 0.0011 for DIV 8). (c) molar ratio linker histone/core histone ratio estimated from (b). The average experimental value of 0.298 obtained for CM, using both approaches, was assigned to a previously determined molecular ratio of 1.3 [Citation45] (shown in red) and this was used as a normalizer for the other tissue and ReNCell samples. The approach provided a 0.76 molar ratio for mouse liver [Citation45] (shown in orange) in good agreement with previously published experimental value. mAU = mili-absorbance units, ACN = acetonitrile.
![Figure 3. Linker histone composition of ReNCell at 0 and 8 DIV. (a-1) RP-HPLC chromatograms of KO RenCell 8 DIV. Elution fractions (38 to 41) were visualized using Coomassie blue stained SDS-PAGE and western blotting using H1.2, H1.4 and H1.5. The asterisks point to contaminating non-histone proteins arising from the whole-cell nature of the HCl extracts used in the HPLC analyses. (a-2) SDS-PAGE of HCl-extracts from different tissues and ReNCell. CM: chicken erythrocyte marker. The red rectangles highlight the histone H1 region. (b-1-2) Linker histone/core histone ratio calculated by quantifying signals from HPLC chromatograms and Coomassie-stained bands respectively (see Fig.S1 and fig S2). Data represent mean of 3–5 independent experiments ± standard error. Unpaired two-tailed t-tests were used to generate the P-values (HPLC p-values are 0.8369 for DIV 0 and 0.0031 for DIV 8. Coomassie p-values are 0.4506 for DIV 0 and 0.0011 for DIV 8). (c) molar ratio linker histone/core histone ratio estimated from (b). The average experimental value of 0.298 obtained for CM, using both approaches, was assigned to a previously determined molecular ratio of 1.3 [Citation45] (shown in red) and this was used as a normalizer for the other tissue and ReNCell samples. The approach provided a 0.76 molar ratio for mouse liver [Citation45] (shown in orange) in good agreement with previously published experimental value. mAU = mili-absorbance units, ACN = acetonitrile.](/cms/asset/7dab93af-3f50-4ebe-8305-24288e481b41/kepi_a_2276425_f0003_oc.jpg)
Figure 4. Levels of expression histone H1 subtypes (H1.0, H1.2, H1.4 and H1.5) and RT-qPCR analysis of their transcripts in ReNcell. (a) western blot analysis of histone H1.0 at different DIV for ReNCell WT and KO in comparison to mouse liver and brain. (b) histone H1/histone H4 ratio for H1.2, H1.4 and H1.5 isoforms for ReNCell WT and KO at 0 DIV; data represent mean of three biological replicates ± standard error. (c) RT-qPCR data for ReNCell 0 DIV and 8 DIV. Histone subtype (H1.2, H1.4 and H1.5) transcripts were quantified via RT-qPCR. RT-qPCR data were analysed using the geomean pfaffl method. Data represent mean of three biological replicates ± standard error. (d) expression of histone H1 gene subtypes H1.2, H1.4 and H1.5 relative to H1.0 expression in WT and KO ReNCell at 0 and 8 DIV.
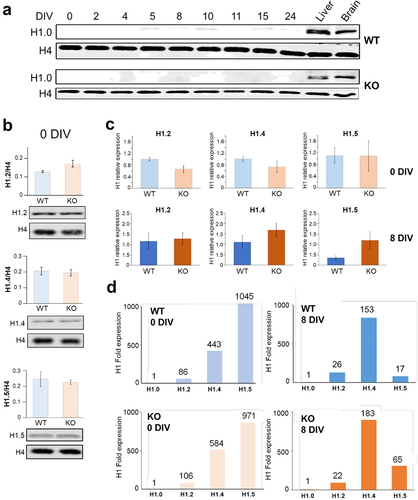
Figure 5. MS analysis of histone H1 phosphorylation. (a) relative amounts of histone H1 phosphorylation for histone H1.2, H1.4 and H1.5 for the HPLC fractions 38 to 41 shown in fig. 3A.1 for WT and KO ReNCell at 0 and 8 DIV. (b) phosphorylation sites determined by targeted MS2 (see materials and methods).
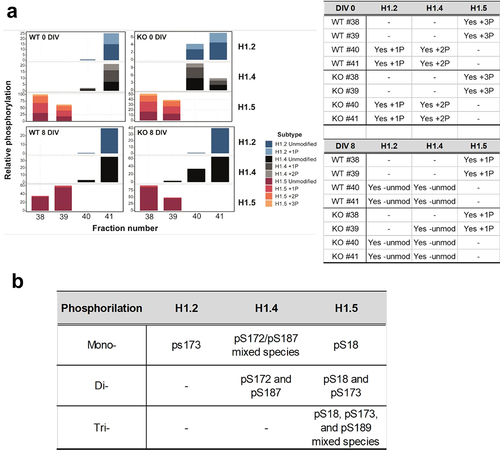
Figure 6. Immunofluorescence imaging of ReNCell WT and KO at 7 DIV. (A) ReNCell WT cells imaged with bright field, DAPI (blue), MeCP2 antibody (red) and histone H1.2, H1.4 and H1.5 antibodies (green). (B) same as in (A) for ReNCell KO. (C) magnified images of the histone isoform staining corresponding to the white rectangles shown in (A) for WT. (D) same as in (C) for KO. Scale bar: 20 µm.
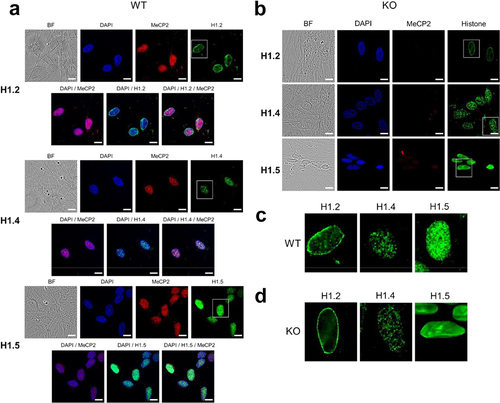
Figure 7. Histone H1 isoform/MeCP2 co-localization. (a) histone H1.2; (b) histone H1.4; (c) histone H1.5. Magnified images for the insets shown in the white rectangles are also provided. (d) quantification of the histone H1 isoform/MeCP2 co-localization using the Pearson’s correlation coefficient (n = 6). Scale bar: 10 µm.
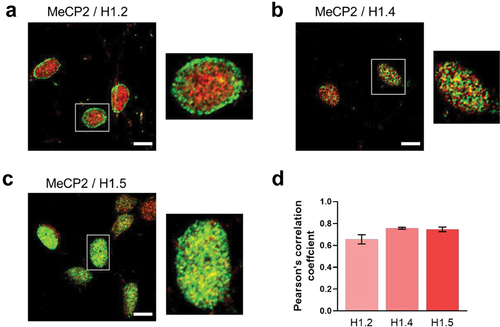
Figure 8. Area of nuclei of WT and MeCP2 KO ReNCell at 0 DIV and 8 DIV. (A) DAPI images and a magnified image of representative sample in (a); (b) measurement of the nuclear areas as those shown in (a) (n = 570 for WT 0; n = 59 for KO 0; n = 285 for WT 8; n = 105 for KO 8. Two sample t-test assuming unequal variances, p < 0.0001 for all comparisons). (c) the change in nuclear diameter (size) during cortical neuron differentiation in WT and MeCP2 KO mouse are shown [Citation92] (purple lines). Also shown are the changes MeCP2 levels (blue) [Citation30,Citation95].
![Figure 8. Area of nuclei of WT and MeCP2 KO ReNCell at 0 DIV and 8 DIV. (A) DAPI images and a magnified image of representative sample in (a); (b) measurement of the nuclear areas as those shown in (a) (n = 570 for WT 0; n = 59 for KO 0; n = 285 for WT 8; n = 105 for KO 8. Two sample t-test assuming unequal variances, p < 0.0001 for all comparisons). (c) the change in nuclear diameter (size) during cortical neuron differentiation in WT and MeCP2 KO mouse are shown [Citation92] (purple lines). Also shown are the changes MeCP2 levels (blue) [Citation30,Citation95].](/cms/asset/99fb99e0-141c-45f5-ac39-253a86578fd0/kepi_a_2276425_f0008_oc.jpg)
Supplemental Material
Download Zip (159.6 KB)Data availability statement
Data available upon request at https://osf.io/cn9sd/?view_only=5204f3c32a644514a249c40365591556