
Figures & data
Figure 1. Renal dysfunction, elevated acute tubular injury score and apoptosis following CLP-induced sepsis. (a) elevation of serum creatinine in mice at 24 h post-CLP treatment. (b&c) Representative images (b) and quantification data (c) of periodic acid-schiff staining in kidneys from mice subjected to CLP at 24 h post-injury. (d&e) Representative images of TUNEL staining showing an increased percentage of TECs apoptosis in the kidneys from CLP mice (d), and the quantification data (e). The data are presented as means ± SDs. One-way ANOVA with LSD post hoc tests were used for the comparisons of 3 groups (n = 6 mice in each group). ***P < 0.001.
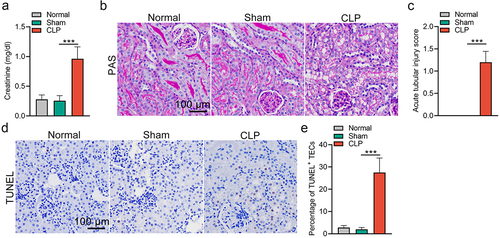
Figure 2. CircRNA expression profiles in the kidney in response to CLP treatment. (a) the distribution of the total expression of the circRNAs in CLP and sham mice. (b) the length distribution of circRNAs was shown in the column chart. (c) the origin of the dysregulated circRNAs in CLP mice. (d) volcano plot showing the differentially expressed circRNAs in CLP mice versus sham mice (n = 3 mice in each group). (e) clustered heatmap of the differentially expressed circRNAs in kidney samples from CLP and sham mice (n = 3 mice in each group). (f) the distribution of up-and down-regulated circRNAs on the chromosome was shown in the column chart. (g) gene ontology analysis on parental genes of the aberrantly expressed circRNAs. The horizontal axis shows the annotated functions of the target genes. The vertical axis shows the number of genes in each cluster. (h) Kyoto Encyclopedia of genes and Genomes analysis on parental genes of the differentially expressed circRNAs.
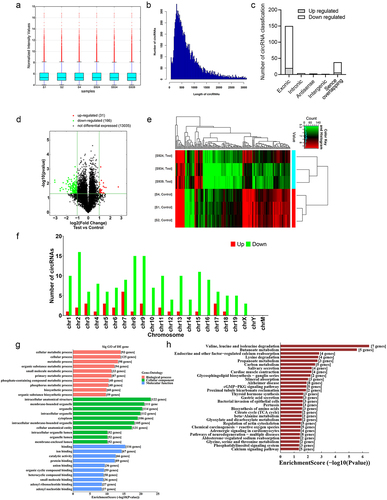
Figure 3. Aberrant activation of NF-κB signalling in injured TECs from CLP mice. (a) clustered heatmap of the differentially expressed mRNAs in kidney samples from CLP and sham mice (n = 3 mice in each group). (b) the scatter plot showed the differentially expressed mRNAs. (c) volcano plot analysis of the differentially expressed mRNA profiles between CLP mice and sham mice. (d) KEGG pathway analysis showed the top 20 enriched pathways of upregulated mRNAs in the renal cortex from CLP mice, as compared to that from sham mice. (e&f) Western blot analysis for p65 and p-p65 in renal cortex from CLP or sham mice (e), and the quantitative analysis results (f). (g) expression of pro-inflammatory factors in renal cortex from mice subjected to CLP. The data are presented as means ± SDs. A two-tailed Student’s t test was used for the comparison of 2 groups (n = 6 mice in each group in e, f and g). ***P < 0.001.
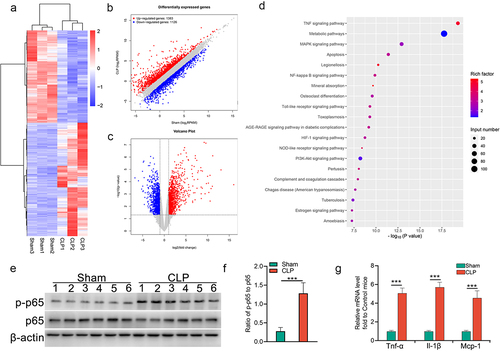
Figure 4. NF-κB/p65 signalling induces circRNAs dysregulation in injured TECs. (a) schematic depiction of the amplification process of circRNA from back-splicing with the aid of divergent primers. (b-d) the relative expression levels of circPsen1, circGrm8, and circNpr3 were detected by the qRT-PCR assay in renal cortex from CLP or sham mice. β-actin was used as a normalizing gene for analysis of specific gene expression. (e) the comparison between circRNA microarray and qRT-PCR results. (f-h) the relative expression levels of circPsen, circGrm8, and circNpr3 were assayed by qRT-PCR in HK2 cells induced by LPS stimulation, with or without NF-κB inhibition by JSH-23 or sc-3060. A two-tailed Student’s t test was used for the comparison of 2 groups. One-way ANOVA with LSD post hoc tests were used for the comparisons of 3 groups. n = 6 mice in each group in b, c, d. ***P < 0.001. For f, g, h, i, j, and k, *P < 0.05, **P < 0.01, ***P < 0.001 versus cells treated with PBS, ###P < 0.001 versus LPS-stimulated cells which were pre-treated with DMSO.
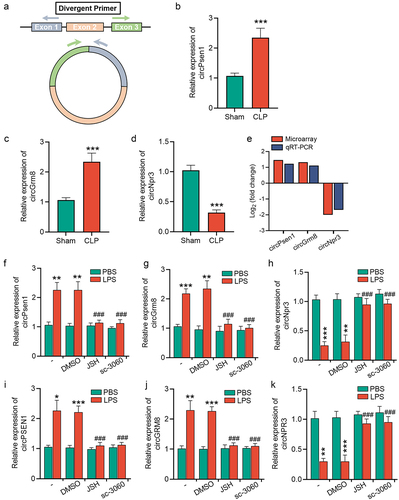
Figure 5. NF-κB/p65 signalling induces upregulation of circRNAs and their linear counterparts by p65 transcription. (a) a venn diagram showing the linear and circular transcription product of four genes (C3, Zbtb16, Fkbp5, and Itgam) were upregulated in renal cortex from CLP mice, as revealed by transcriptome sequencing and circRNA microarray. (b) schematic depiction of the amplification process of circRNA, mRNA, and pre-mRNA of each gene. (c-f) qRT-PCR showing the relative expression of the circular and linear transcript products of C3 (c), Zbtb16 (d), Fkbp5 (e), and Itgam (f) in mTECs stimulated with LPS for 24 h. (g-i) ChIP assays showing that p65 bound to the κB-binding site in the promoter regions of C3, Zbtb16, and Fkbp5 under LPS stimulation (10 μg/mL, 3 h) in mTECs. A two-tailed Student’s t test was used for the comparison of 2 groups. One-way ANOVA with LSD post hoc tests were used for the comparisons of 3 groups. n = 3 in each group. *P < 0.05, **P < 0.01, ***P < 0.001.
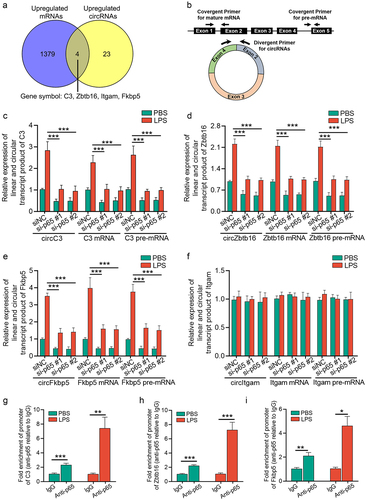
Figure 6. Prediction of circRNAs/miRNAs/NF-κB signalling axes in CLP mice. the network includes ten circRNAs, ten miRNAs, and six NF-κB signalling-associated mRNAs, which were constructed and visualized by cytoscape software. The ovals represented circRNAs, the rhombuses represented miRNAs and the hexagons represented mRNAs. The connections among circFkbp5/miR-760-3p/Tnf-α axis and circElmod2/miR-23a-3p/Tnfaip3 axis were specific, which were marked with a dotted line.
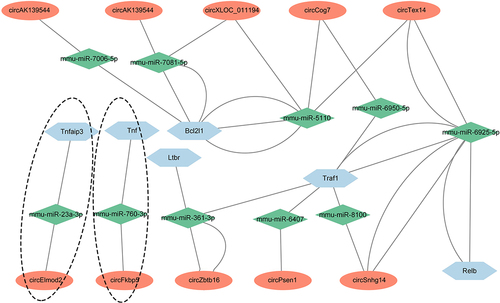
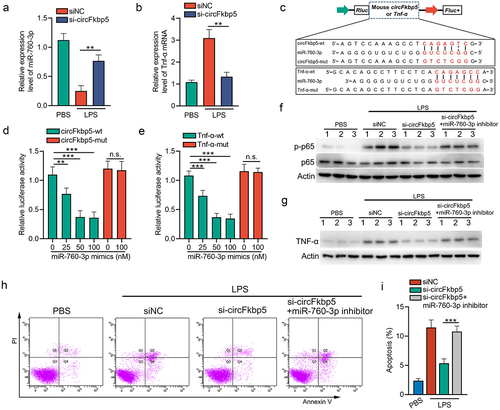
Figure 7. CircFkbp5, a downstream target of NF-κB signalling, promotes TECs apoptosis via sponging miR-760-3p. (a&b) qRT-PCR showing the relative expression of miR-760-3p and Tnf-α mRNA. (c) schematic illustration of circFkbp5-wt, Tnf-α-wt, circFkbp5-mut, and Tnf-α-mut luciferase reporter vectors. (d&e) luciferase assays in mTECs co-transfected with WT or mutated luciferase reporter vectors of circFkbp5 (d) and Tnf-α (e), together with different doses of miR-760-3p mimics. (f&d) Western blot analysis for p65 and p-p65 (f) or Tnf-α (g) in LPS-stimulated-mTECs transfected with si-circFkbp5 or miR-760-3p inhibitor. (h&i) the effects of si-circFkbp5 or miR-760-3p inhibitor on apoptosis in LPS-stimulated-mTECs (h), and the quantification data (i). A two-tailed Student’s t test was used for the comparison of 2 groups. One-way ANOVA with LSD post hoc tests were used for the comparisons of 3 groups. n = 3 in each group. **P < 0.01, ***P < 0.001. n.s. indicates not significant.
Supplemental Material
Download Zip (1.4 MB)Data availability statement
RNA-seq and microarray data were deposited in GEO (GSE220812 and GSE220782).