Figures & data
Figure 1. DNA methylome characteristics of chicken embryonic gonads: (a) CG methylation level Pearson correlation analysis. The varying shades of color represent the degree of correlation; (b) Principal component analysis (PCA) of DNA methylation at the genome-wide level; (c) genome-wide differences in methylation levels between sexes at E6 (left panel) and E10 (right panel). From outside to inside are male methylation level, difference in methylation level between males and females, and female methylation level, respectively; color grading indicates the methylation level; (d) dendrogram clustering of CG methylation levels in each sample. The closer distance, the higher similarity among them.
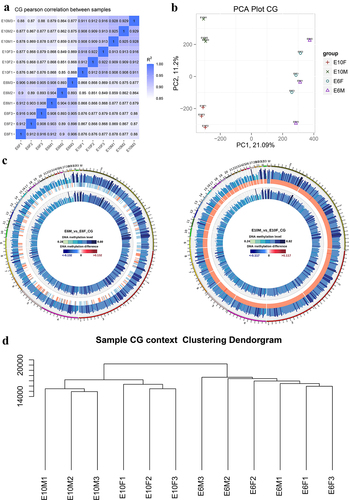
Figure 2. Distribution of DNA methylation levels in chicken embryonic gonads: (a) the violin plot displays the DNA methylation levels of CG, CHG, and CHH contexts in males and females at E6 and E10, where H represents any nucleotide other than G; (b) the bar chart illustrates the methylation levels of functional elements, with the gray bars representing T-test error bars. There were no significant differences observed among the samples within each group. CGI (CpG island) refers to DNA regions that have a high density of CG sites and are typically longer (> 200 bp) than surrounding regions. CGI shore represents the regions adjacent to CGIs, generally defined as a DNA region within 1000 bp of the CGI itself.
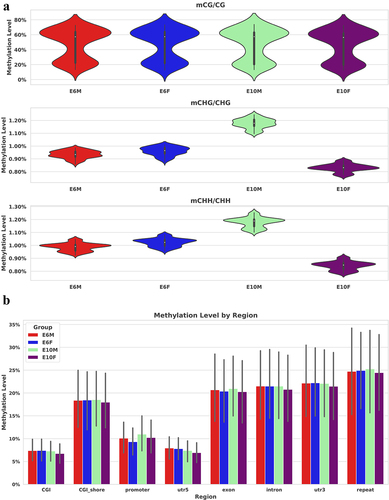
Figure 3. Cluster analysis of differentially methylated regions between sexes at E6 and E10. The varying shades of color represent the methylation level.
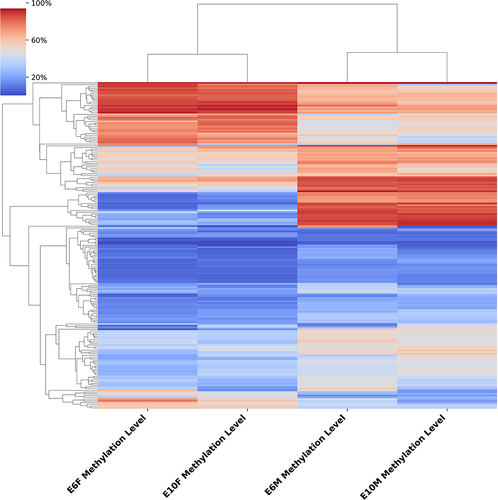
Figure 4. Functional enrichment analysis of differentially methylated genes: (a) the cluster heatmap displays the methylation levels of CG-DMRs between sexes at E6 (left panel) and E10 (right panel). The varying shades of color represent the methylation level; (b) GO enrichment analysis of differentially methylated genes between sexes at E6 (left panel) and E10 (right panel); (c) KEGG pathway analysis of differentially methylated genes between sexes at E6 (left panel) and E10 (right panel).
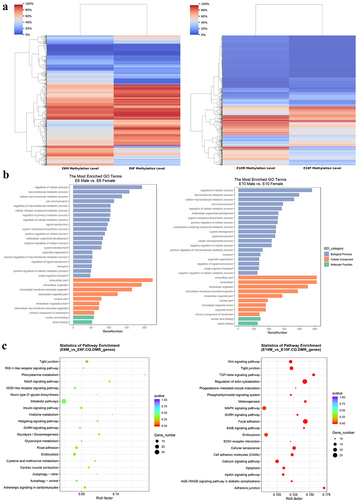
Figure 5. Functional enrichment analysis of differentially expressed genes: (a) the volcano plot displays DEGs between sexes at E6 (left panel) and E10 (right panel), highlighting the major genes involved in sex determination in chickens; (b) GO enrichment analysis of DEGs between sexes at E6 (left panel) and E10 (right panel); (c) KEGG pathway analysis of DEGs between sexes at E6 (left panel) and E10 (right panel).
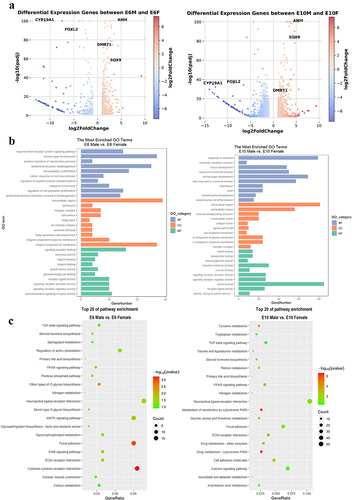
Figure 6. Combined analysis of differentially methylated genes and differentially expressed genes: (a-c) the scatter plot shows the log2 fold change of gene expression and differential methylation levels between sexes at E6 (left panel) and E10 (right panel) in promoter (a), exon (b), and intron (c); (d) correlation heatmap of between sexes at E6 (top panel) and E10 (bottom panel) in promoter, exon, and intron; (e) the Venn diagram illustrates the intersection and differences between DMGs and DEGs.
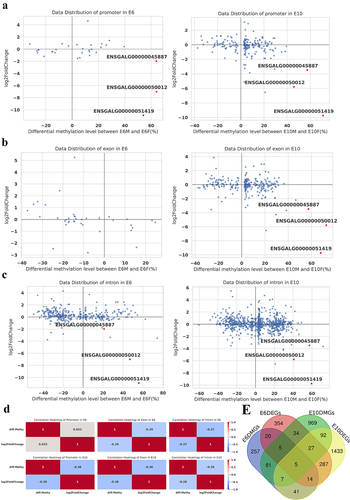
Table 1. Correlation of DNA methylation differences in functional regions with differential mRNA expression.
Table 2. Differentially methylated promoter and differentially expressed genes.
Figure 7. BSP and qRT-PCR of candidate lncRnas. (a), (b), and (c) show the validation results for ENSGALG00000050012, ENSGALG00000051419, and ENSGALG00000045887, respectively. In each figure, the upper left figure shows the WGBS sequencing result, the box is the verification region, the upper right figure is the BSP sequencing result, the black dots indicate the sites where methylation groups occurred, and the white dots indicate non-methylated sites. The lower figure is the result of qRT-PCR. G, B, and M represent the gonads, brain, and muscle, respectively, and AI represents the aromatase inhibitor treatment group. Asterisks above the bars indicate statistically significant differences between samples: *P < 0.05, **P < 0.01, ***P < 0.005, ****P < 0.001.
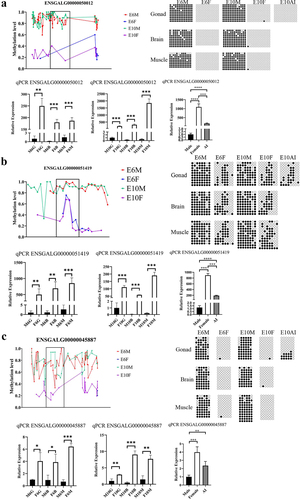
Figure 8. FISH reveals the spatial expression of candidate lncRnas. Marker genes and candidate genes are displayed in different colors, with the marker gene CVH for primordial germ cells shown in green, the marker genes FOXL2 for ovarian follicle cells and SOX9 for testicular Sertoli cells depicted in yellow. The candidate genes ENSGALG00000050012 and ENSGALG00000051419 are respectively represented in red and blue. (a) and (b) represent the female gonad and male gonad, respectively. (c) and (d) show enlarged views of the orange-boxed regions in the upper images.
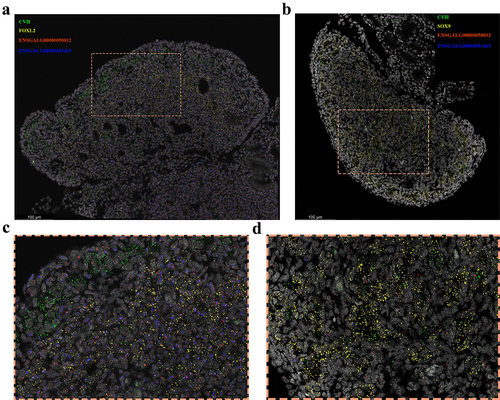
Figure 9. Validation of candidate gene expression after 5-Aza-CdR treatment in DF-1 cells by qPCR. (a): ENSGALG00000050012; (b): ENSGALG00000051419; (c): ENSGALG00000045887. Different letters of a, b and c above the bars indicate a statistically significant difference (p < 0.05) among different groups, while the same letters indicate that the difference is not statistically significant (p > 0.05).
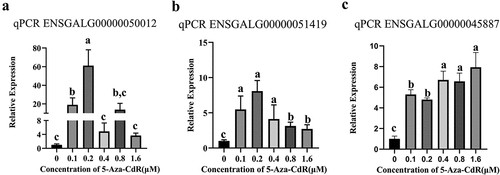
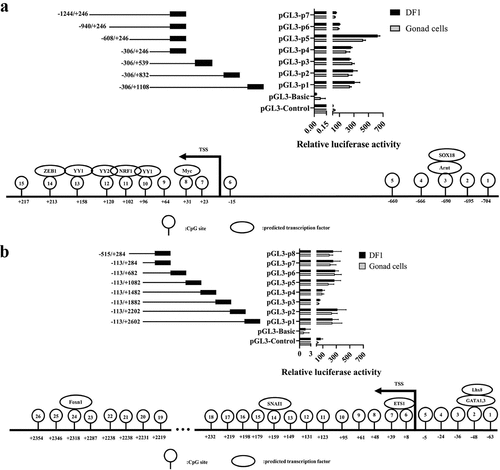
Figure 10. Fluorescence activity analysis of truncated promoter and prediction of transcription factor binding sites. (a) ENSGALG00000050012, (b) ENSGALG00000051419, the top panel and bottom panel were fluorescence activity in promoter and predicted transcription factor binding sites in the promoter, respectively.