Figures & data
Figure 1. NEAT1 and Apelin are dysregulated in mice with T2DM exposed to IH. KKAy mice were divided into the T2DM + IH group (mice exposed to intermittent hypoxia) and the T2DM group (mice exposed to intermittent normoxic air). (a) fasting blood glucose was measured using a glucose meter in each mouse. (b) qRT-PCR was performed to detect NEAT1 and Apelin expression in the aortic vascular tissues of each mouse. (c) protein expression levels of Apelin, Nrf2, and HO-1 were examined using western blot in the aortic vascular tissues of each mouse. (d and e) SOD activity and GSH production were assessed using commercial assay kits in the aortic vascular tissues of each mouse. (f) ELISA was performed to analyze the levels of TNF-α, IL-6, IL-1β, and IL-8 in the serum of each mouse. **p < 0.01, ***p < 0.001.
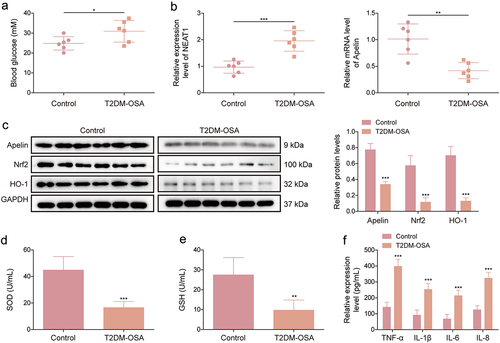
Figure 2. The combination of HG and IH dramatically increased NEAT1 expression and decreased Apelin expression in HMEC-1 cells. HMEC-1 cells were divided into the control, HG, IH, and HG + IH groups. The RNA expression of NEAT1 and Apelin was analysed using qRT-PCR (a and b). Apelin protein expression was analysed using western blot (c). Cell viability was analysed using CCK-8 assay (d). Cell apoptosis was analysed using flow cytometry (e). TNF-α, IL-1β, IL-6, and IL-8 levels were analysed using ELISA (f). (g) the Cellular ROS assay kit was used to analyze ROS levels. (h) the lipid peroxidation MDA, superoxide dismutase activity, and GSH assay kits were used to detect MDA levels, SOD activity, and GSH production, respectively. *p < 0.05, **p < 0.01, ***p < 0.001.
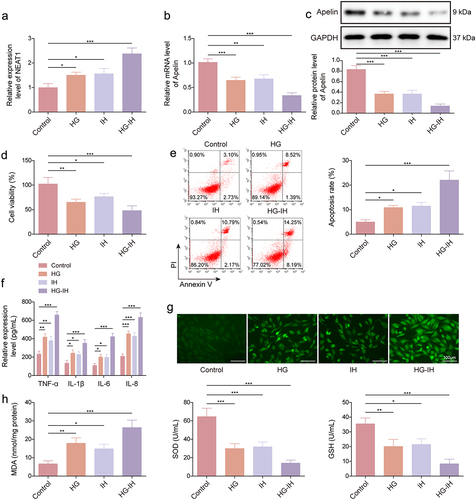
Figure 3. NEAT1 knockdown protected HMEC-1 cells from HG- and IH-induced damage. HMEC-1 cells were divided into the control, HG-IH, HG-IH + sh-NC, and HG-IH + sh-NEAT1 groups. NEAT1 expression was analysed using qRT-PCR (a). Cell viability was analysed using CCK-8 assay (b). Cell apoptosis was investigated using flow cytometry (c). TNF-α, IL-1β, IL-6, and IL-8 levels were detected using ELISA (d). ROS level, MDA level, SOD activity, and GSH production were assessed using commercial assay kits (e and f). *p < 0.05, **p < 0.01, ***p < 0.001.
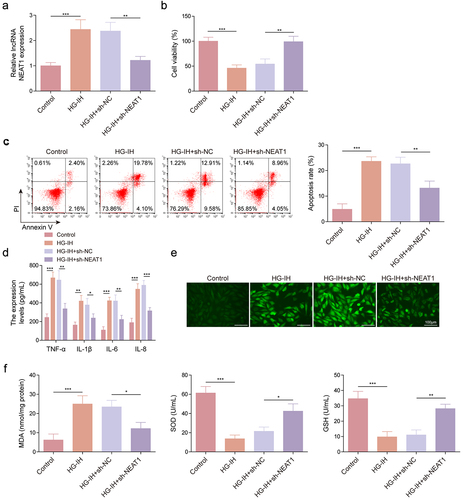
Figure 4. NEAT1 destabilized Apelin mRNA by recruiting UPF1. (a – c) RIP and RNA pull-down assays were performed to identify the associations between NEAT1, UPF1, and Apelin in HMEC-1 cells. (d) the efficiency of UPF1 overexpression was analyzed using western blot. (e and f) the effects of NEAT1 knockdown and UPF1 overexpression on Apelin expression in HMEC-1 cells were determined using qRT-PCR and western blot assays. (g) actinomycin D assay was performed to investigate the effects of NEAT1 knockdown and UPF1 overexpression on Apelin mRNA degradation. *p < 0.05, **p < 0.01, ***p < 0.001.
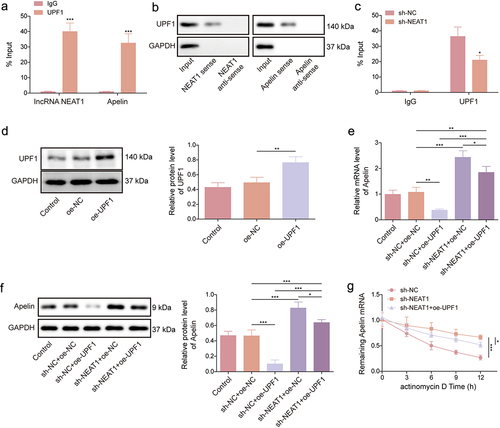
Figure 5. Apelin overexpression protected against HG- and IH-induced HMEC-1 cell injury by activating the Nrf2/HO-1 signalling pathway. HMEC-1 cells were divided into the control, HG-IH, HG-IH + oe-NC, and HG-IH + oe-Apelin groups. Apelin expression was analysed using qRT-PCR and western blot (a and g). Cell viability was detected using CCK-8 assay (c). Cell apoptosis was analysed using flow cytometry (d). TNF-α, IL-1β, IL-6, and IL-8 levels were analysed using ELISA (e). ROS level, MDA level, SOD activity, and GSH production were assessed using commercial assay kits (f and g). Nrf2 and HO-1 protein expression was detected using western blot (h). *p < 0.05, **p < 0.01, ***p < 0.001.
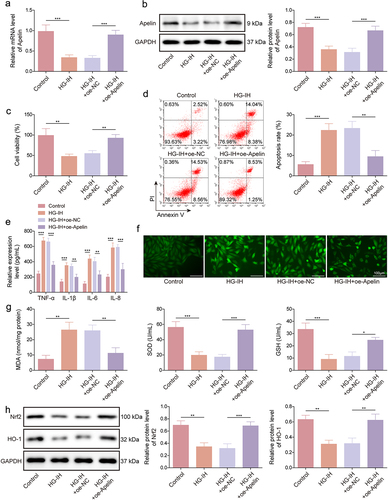
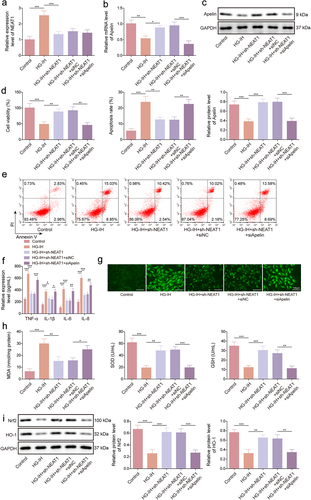
Figure 6. NEAT1 silencing protected against HG- and IH-induced HMEC-1 cell injury by modulating Apelin. HMEC-1 cells were divided into the control, HG-IH, HG-IH + sh-NEAT1, HG-IH + sh-NEAT1 + si-NC, and HG-IH + sh-NEAT1 + si-Apelin groups. NEAT1 expression was assessed using qRT-PCR (a). Apelin expression was detected using qRT-PCR and western blot (b and c). Cell viability was analysed using CCK-8 assay (d). Cell apoptosis was analysed using flow cytometry (e). TNF-α, IL-1β, IL-6, and IL-8 levels were detected using ELISA (f). ROS level, MDA level, SOD activity, and GSH production were assessed using commercial assay kits (g and h). Nrf2 and HO-1 protein expression was detected using western blot (i). *p < 0.05, **p < 0.01, ***p < 0.001.