
Figures & data
Figure 1. Normalised expression of the imprinted genes Kcnq1ot1 (a), Slc22a18 (b), and the non-imprinted gene Cars (c) in kidney tissues of sham and IUGR rat offspring at embryonic day 20 (E20) and postnatal day 1 (PN1). Significance was determined by linear mixed effect models, followed by a Tukey’s post hoc test (**p < 0.01). Data is expressed as mean ± SD; n = 8–10/group.
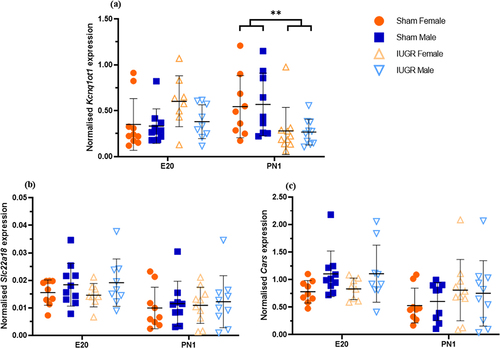
Figure 2. Spearman’s non-parametric correlation matrices between three imprinted genes known to be important in kidney development and regulated by the KvDMR1 imprinting control region (Kcnq1ot1, Cdkn1c and Kcnq1) in kidney tissues of sham and IUGR rat offspring at embryonic day 20 (E20) and postnatal day 1 (PN1). Sham and IUGR data were combined in (a) for E20 and (d) for PN1. Spearman correlation coefficients (top number) and p-values (bottom number) are displayed on the right triangles. A cross through the box indicates a non-significant p-value. The size of the circle indicates how strong the correlation is (corresponded to the Spearman correlation coefficients).
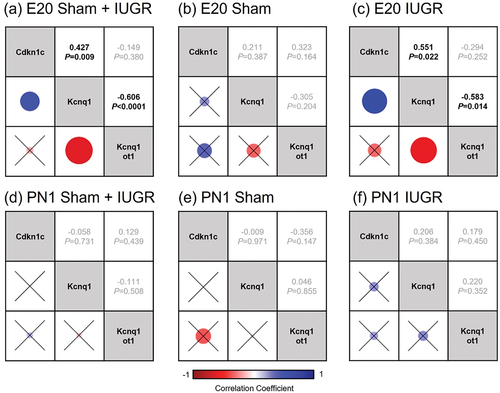
Figure 3. DNA methylation status of the KvDMR1 imprinting control region containing (a) CpG 23 (amplicon 1 (amp1), chr1:198,492,806–198,493,065, UCSC genome Browser Nov. 2020 (mRatbn7/rn7)) and (b) CpG 20 (amplicon 13 (amp13), chr1:198,493,269–198,493,580 (mRatbn7/rn7)) in sham and IUGR rat offspring at postnatal day 1 (PN1), determined using EpiTYPER Agena MassArray and mass cleave chemistry analyses. For CpG fragments that had the same mass peaks as other fragments containing same number of CpGs (Amp13, CpG_5.6 versus CpG_7.8 and CpG_14 versus CpG_18), methylation % was calculated between CpGs. Significance was determined by linear mixed effect models, followed by a Tukey’s post hoc test (*p < 0.05). Data is expressed as mean ± SD; n = 8–9/group.
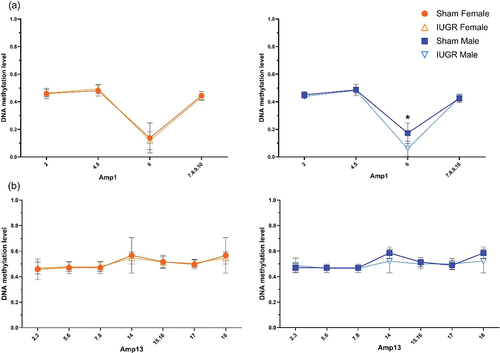
Figure 4. Approximate positions of the two amplicons (amplicon 1 and 13, targeting CpG island 23 (chr1:198,492,806–198,493,065) and 20 (chr1:198,493,269–198,493) (mRatbn7/rn7), respectively) in the rat KvDMR1 imprinting control region (modified from Doan et al [Citation12].), examined using region-specific quantitative DNA methylation analysis. DNA methylation of KvDMR1 and/or expression of the lncRNA Kcnq1ot1 is known to play a role in controlling the monoallelic expression of imprinted genes in the KvDMR1 imprinting cluster. Primers were designed by the Australian genome Research Facility (AGRF). There was a hypomethylation (↓11.25%, p < 0.05) at CpG site 6 of CpG 23 island in PN1 growth restricted male kidneys. Kcnq1ot1 sequence is not available on the mRatbn7/rn7 rat genome. Hence, sequence from the uncharacterized lncRNA named LOC120099961 found on the rat mRatbn7.2 genome (NCBI reference sequence: NC_051336.1, similar position) was used. Mouse sequences, including KvDMR1 region [Citation28], Kcnq1ot1 transcriptional repressor CTCF binding sites [Citation29], enhancer, promoter [Citation30], and transcription start site [Citation30,Citation31] were used in a BLAT search against the rat genome. ↓: expression decreased; ↑: expression increased; (-): no change in gene expression. Note that the annotations of gene expressions in this figure is based on the circumstance that in a healthy animal, the imprinted genes Kcnq1 and Cdkn1c are expressed on the maternal allele, while Kcnq1ot1 is preferentially expressed on the paternal allele.
![Figure 4. Approximate positions of the two amplicons (amplicon 1 and 13, targeting CpG island 23 (chr1:198,492,806–198,493,065) and 20 (chr1:198,493,269–198,493) (mRatbn7/rn7), respectively) in the rat KvDMR1 imprinting control region (modified from Doan et al [Citation12].), examined using region-specific quantitative DNA methylation analysis. DNA methylation of KvDMR1 and/or expression of the lncRNA Kcnq1ot1 is known to play a role in controlling the monoallelic expression of imprinted genes in the KvDMR1 imprinting cluster. Primers were designed by the Australian genome Research Facility (AGRF). There was a hypomethylation (↓11.25%, p < 0.05) at CpG site 6 of CpG 23 island in PN1 growth restricted male kidneys. Kcnq1ot1 sequence is not available on the mRatbn7/rn7 rat genome. Hence, sequence from the uncharacterized lncRNA named LOC120099961 found on the rat mRatbn7.2 genome (NCBI reference sequence: NC_051336.1, similar position) was used. Mouse sequences, including KvDMR1 region [Citation28], Kcnq1ot1 transcriptional repressor CTCF binding sites [Citation29], enhancer, promoter [Citation30], and transcription start site [Citation30,Citation31] were used in a BLAT search against the rat genome. ↓: expression decreased; ↑: expression increased; (-): no change in gene expression. Note that the annotations of gene expressions in this figure is based on the circumstance that in a healthy animal, the imprinted genes Kcnq1 and Cdkn1c are expressed on the maternal allele, while Kcnq1ot1 is preferentially expressed on the paternal allele.](/cms/asset/5613ad08-9704-49cf-8de2-03c65de465a3/kepi_a_2294516_f0004_oc.jpg)
Table 1. Transcription factor binding sites (TFBSs) correspond to CpG:23 island (amplicon 1, chr1:198,492,806–198,493,065), where there was a hypomethylation at CpG site 6 (coloured in red) in IUGR male kidneys. TFBSs were determined using TFBIND software (weight matrix in transcription factor database TRANSFAC R.3.4) [32] and TRANSFAC FACTOR TABLE (release 2017.2). Left to right: TF name, matrix ID (from TRANSFAC R.3.4), label in TFBIND, similarity compared to input sequence, strand that the transcription factor binds, and sequence of the TFBS.
Supplemental Material
Download MS Word (947.9 KB)Data availability statement
The data that support the findings of this study are available from the corresponding author ([email protected]) upon request.