
Figures & data
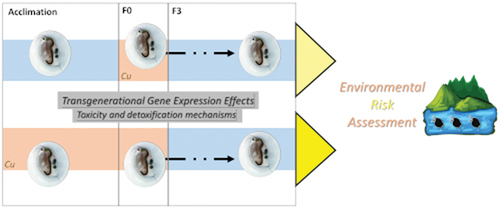
Figure 1. Box whisker plots representing mRNA levels regarding DNA damage and repair genes (left-hand panel), detoxification and antioxidant genes (central panel) and circadian rhythm and arginine metabolism genes (right-hand panel) in the experimental treatments. The horizontal line within the box indicates the median (plus sign locates the mean), the boundaries of the box the 25th and 75th percentiles, and the whiskers the highest and lowest results. Asterisks (*), circles (●) and squares (■) denote significant statistical differences (kruskal-Wallis; p-value <0.05) in gene expression in respect to the control, F0 non-naïve (Cu+/+) and naïve (Cu−/+) treatments, respectively.
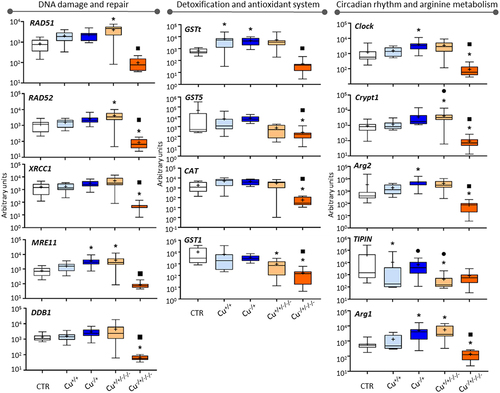
Figure 2. Box whisker plots representing mRNA levels of DNA methylation and non-coding RNAs genes in the experimental treatments. The horizontal line within the box indicates the median (plus sign locates the mean), the boundaries of the box the 25th and 75th percentiles, and the whiskers the highest and lowest results. Asterisks (*), circles (●) and squares (■) denote significant statistical differences (kruskal-Wallis; p-value <0.05) in gene expression in respect to the control, F0 non-naïve (Cu+/+) and naïve (Cu−/+) treatments, respectively.
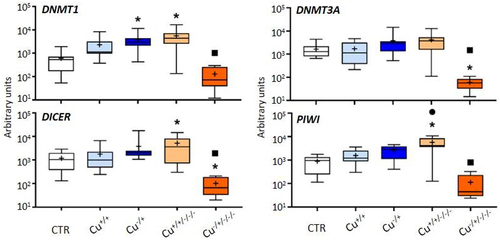
Figure 3. Box whisker plots representing mRNA levels concerning histone deacetylase genes (left-hand panel), histone acetyltransferase genes (central panel), and lysine methyltransferase genes (right-hand panel) in the experimental treatments. The horizontal line within the box indicates the median (plus sign locates the mean), the boundaries of the box the 25th and 75th percentiles, and the whiskers the highest and lowest results. Asterisks (*), circles (●) and squares (■) denote significant statistical differences (kruskal-Wallis; p-value <0.05) in gene expression in respect to the control, F0 non-naïve (Cu+/+) and naïve (Cu−/+) treatments, respectively.
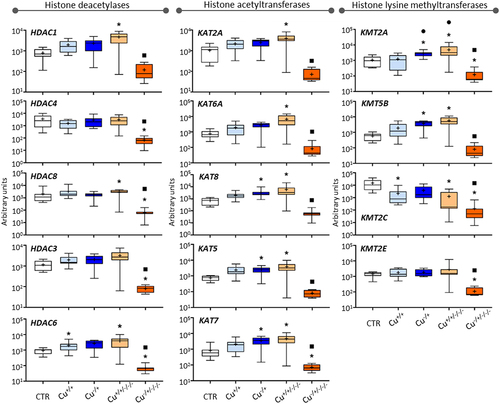
Figure 4. Box whisker plots representing mRNA levels of other histone modifier genes in the experimental treatments. The horizontal line within the box indicates the median (plus sign locates the mean), the boundaries of the box the 25th and 75th percentiles, and the whiskers the highest and lowest results. Asterisks (*) and squares (■) denote significant statistical differences (kruskal-Wallis; p-value <0.05) in gene expression in respect to the control, and F0 naïve (Cu−/+) treatments, respectively.
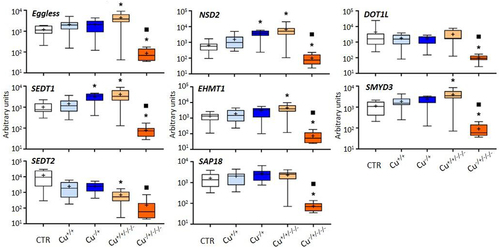
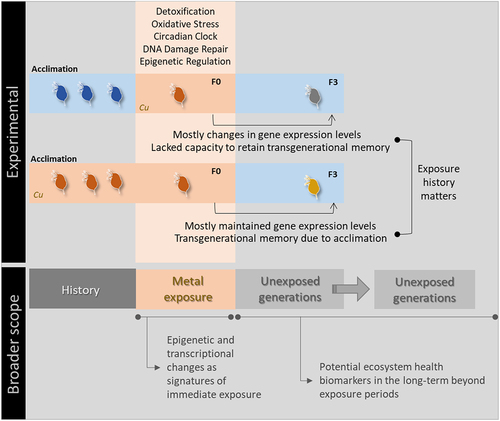
Figure 5. Schematic representation of the main findings of the study and their relation to the broader environmental assessment context.
-)Revised_SupplementaryMaterial_Jeremias2023_Final.doc
Download MS Word (426.5 KB)Data availability statement
The authors confirm that the data supporting the findings of this study are available within the article and its supplementary materials.