Figures & data
Table 1. Clinical characteristics of the subjects whose data were used to identify candidate markers.
Table 2. Leading candidates from initial screening efforts to identify rapidly reverting loci.
Figure 1. The correlation between the Illumina probe assessment and the MSdPCR assessments at the Alc12 locus (n = 90) using the Dcg07375256 assay. Overall, the r = 0.92 with the dynamic range of the ddPCR being considerably greater than that of the methylation array.
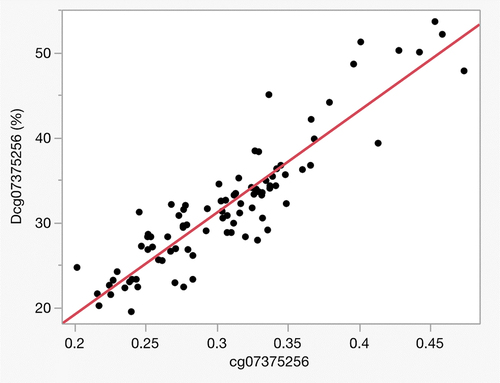
Figure 2. Methylation at cg07375256 in HAC subjects at study intake (T1) and exit (T2), and in abstinent controls (n = 46, all groups).
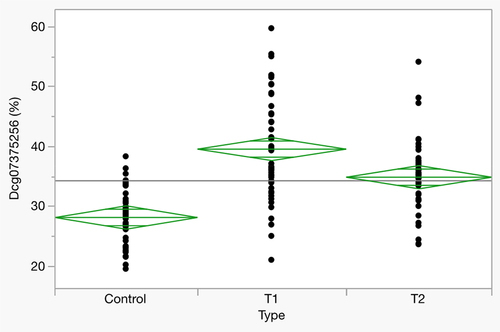
Table 3. Clinical characteristics of alcohol withdrawal subjects and new controls.
Figure 3. The correlation of study variables to each other. * = p < 0.05, ** p < 0.01, *** p < 0.001. Age is expressed in years. Sex is binary variable whether or not the subject is male. Drinks scale is an ordinal variable with higher score indicating greater intake. PAWSS is prediction of alcohol withdrawal syndrome scale. BAC > 200 indicates if a breathalyser value greater than 200 mg/dl was noted at admission. CDT is carbohydrate transferrin levels. Cg05575921 is DNA methylation at that smoking related locus. ATS is alcohol T score. ZSCAN25 is DNA methylation per the Dcg07375256 described herein. Diazepam equivalents is the sum total equivalent of all benzodiazepines administered during hospitalization for AWS. Phenobarbital is a binomial variable indicating whether or not phenobarbital was given during hospitalization for AWS. Seizures, hallucinations, admission to the ICU, and delirium tremens (DTs) are binomial variable for the presence of those symptoms.
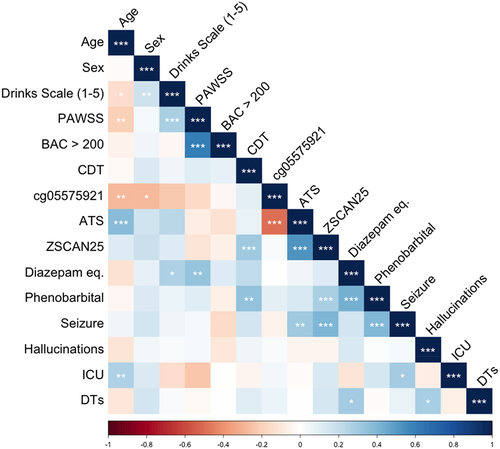
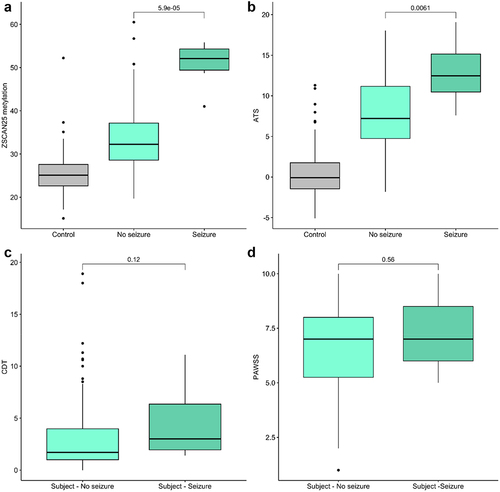
Figure 4. The relationship of predictor (PAWSS, ATS, CDT and ZSCAN (Dcg07375256)) values to treatment group. ZSCAN25 methylation and CDT values are given in percent. ATS and PAWSS have no unit values. Because control subjects were not administered the PAWSS, their values are not considered in that section of the analyses. Kruskal-Wallis p-values are given for each indicated contrasts.
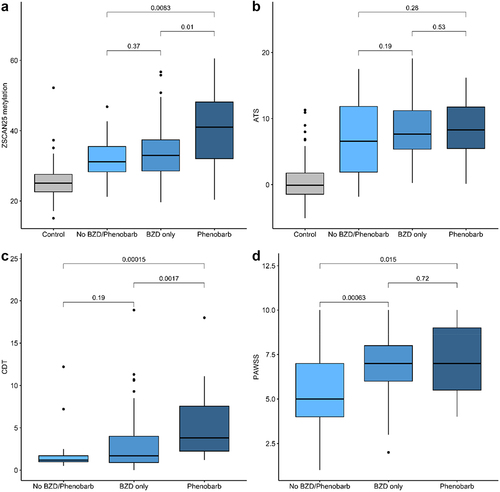
Figure 5. The relationship between predictor (PAWSS, ATS, CDT and ZSCAN (Dcg07375256)) levels and presence (1) or absence (0) of seizures. N = 7 for the seizure group, 116 for the no seizure group. ZSCAN25 methylation and CDT values are given in percent. ATS and PAWSS have no unit values. Kruskal-Wallis p-values are given for each indicated contrasts.