
Figures & data
Figure 1. General characteristics of RNA m6A methylation. (a) Venn diagram showing the number of shared and unique m6A peaks in the two groups. (b) Chromosomal distribution of m6A peaks in both groups. (c) Number distribution of m6A peaks spanning different exon numbers in the two groups. (d) The number of single-base sites and the average log2 fold enrichment of single-base site peaks in the 5-fu group and the control group. (e) The positional distribution of m6A peaks on functional elements of genes in the two groups.
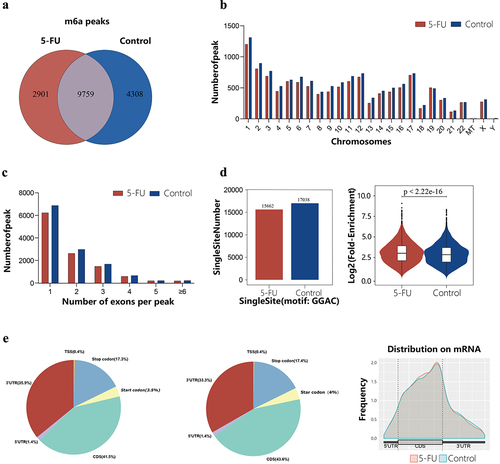
Figure 2. Conserved sequence motifs of m6A peaks between 5fu and control groups.
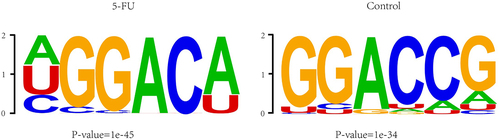
Figure 3. Overview of the differentially methylated m6A peaks landscape in the 5fu and control samples. (a) The differentially m6A modification volcano plot showing distinct m6A peaks and their statistical significance. (b) Pie charts displaying the positional distribution of the differentially methylated m6A peaks on functional elements of genes. (c) Distribution of the differentially methylated m6A peaks on chromosomes. (d) Number distribution of the differentially methylated m6A peaks spanning different exon numbers. (e) The number of single-base sites and m6A peaks in upregulated and downregulated m6A peaks. (f) The average log2 fold enrichment of the differentially methylated m6A peaks. (g) The distribution of p-value of the differentially methylated m6A peaks.
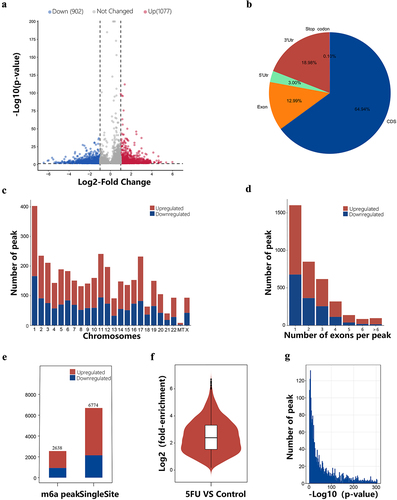
Table 1. The top ten significantly up- regulated or down-regulated m6A modified peaks.
Figure 4. GO function and KEGG pathway enrichment of hyper-methylated and hypo-methylated mRnas. (a) The top 20 GO terms of genes with upregulated m6A peaks. (b) The top 20 GO terms of genes with downregulated m6A peaks. (c) The top 20 KEGG pathways of genes with upregulated m6A peaks. (d) The top 20 KEGG pathways of genes with downregulated m6A peaks.
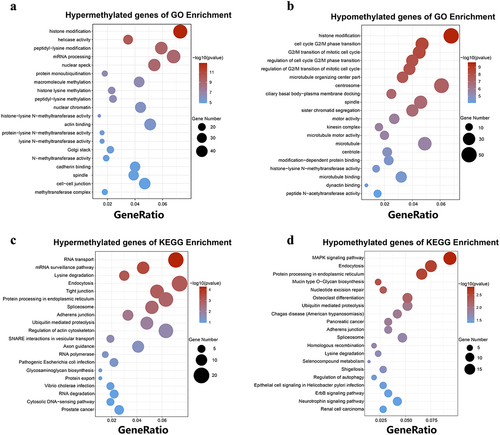
Figure 5. The differential expression of lncRnas and mRnas and functional enrichment analysis of mRnas. (a) The differentially expressed lncRnas in the 5FU group and control group. (b) The differentially expression of mRnas in the 5FU group and control group. (c) Hierarchical cluster analysis of differentially expressed mRnas genes. (d) Hierarchical cluster analysis of differentially expressed lncRnas genes. (e) GO enrichment analysis of differentially expressed mRnas. (f) KEGG pathways enrichment analysis of differentially expressed mRnas.
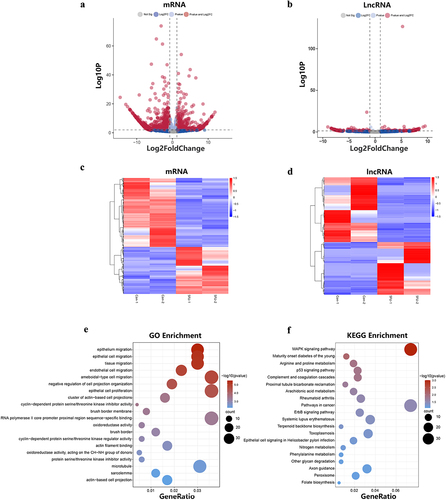
Figure 6. Integrated analysis of m6A methylation and mRNA expression. (a) Four quadrant diagram showing differentially methylated and differentially expressed RNAs. (b) The RNA expression level was positively correlated with the methylation level (R2 = 0.11, p < 0.0001). (c) The top 10 statistically significant GO enrichment analysis terms. (d) GO enrichment analysis of mRnas with both differential methylation and expression. (e) KEGG pathways enrichment analysis of mRnas with both differential methylation and expression.
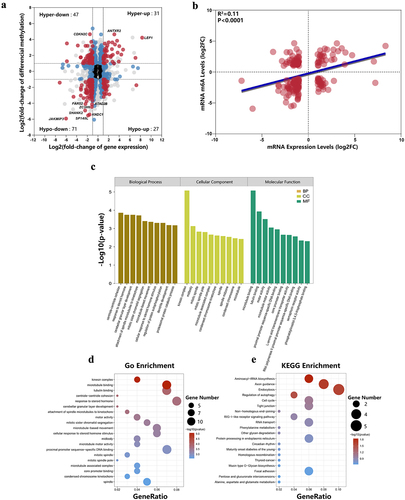
Figure 7. Enrichment analysis of target genes with differentially m6A methylated lncRnas. (a) GO biological processes enrichment analysis. (b) GO cellular component enrichment analysis. (c) GO molecular function enrichment analysis. (d) KEGG enrichment analysis.
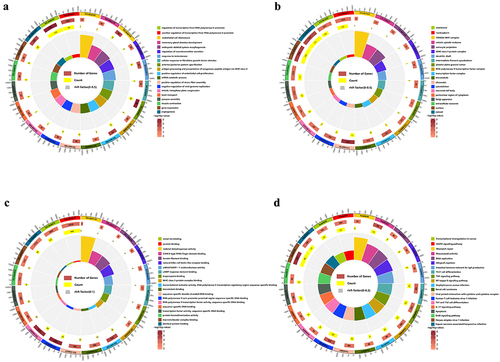
Figure 8. Integrated analysis of lncRnas in the RNA-seq and MeRIP-seq data. (a) The network of lncRNA-mRNA regulation, the circle represents mRNA and the diamond represents lncRnas with both differential methylation and expression, red means high expression and blue means low expression, purple means high methylation and green means low methylation. (b) GO biological processes enrichment analysis. (c) GO cellular component enrichment analysis. (d) GO molecular function enrichment analysis. (e) KEGG enrichment analysis.
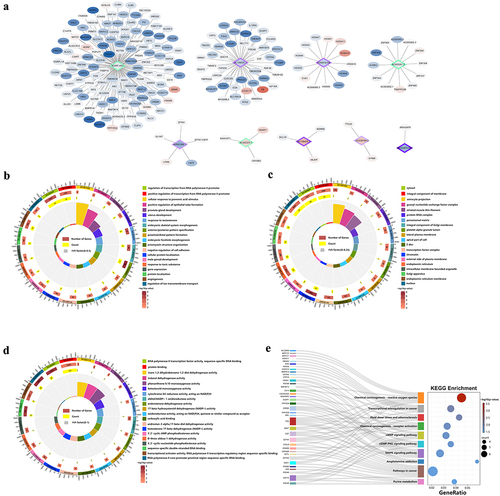
Figure 9. Validation of MeRIP-seq and RNA-seq. (a) RT-qPCR validation of four lncRnas. (b) SELECT-PCR validation of four lncRnas. (c) MeRIP-qPCR validation of three m6A-modified lncRnas and mRnas.
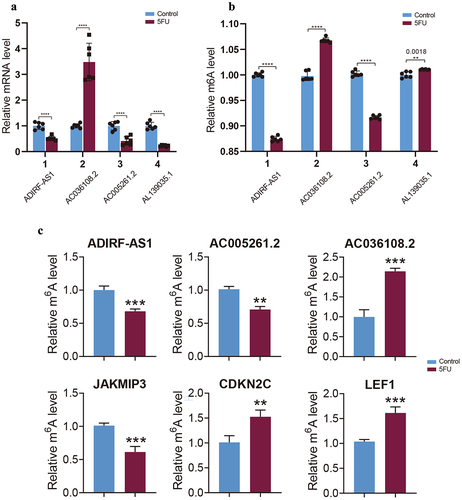
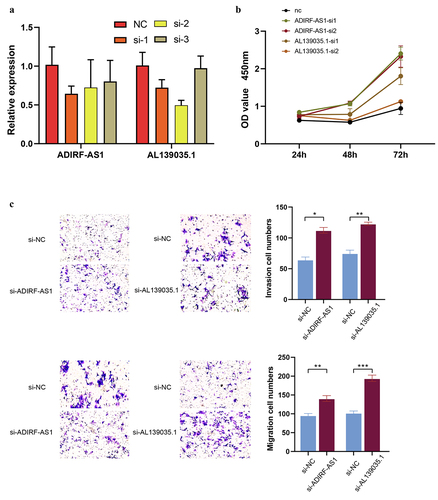
Figure 10. Knockdown of lncRNA ADIRF-AS1 and AL139035.1 promoted CRC proliferation and invasive metastasis in vitro. (a) Validation of siRNA knockdown inefficiency. (b) Knockdown of ADIRF-AS1 and AL139035.1 promotes CRC proliferation in vitro (c) knockdown of ADIRF-AS1 and AL139035.1 promotes CRC invasion and migration.
Supplementary Table 5.xlsx
Download MS Excel (957.3 KB)Supplementary Table 10.xlsx
Download MS Excel (61.8 KB)Supplementary Table 7.xlsx
Download MS Excel (56.1 KB)Supplementary Table 9.xlsx
Download MS Excel (103.7 KB)Supplementary Table 11.xlsx
Download MS Excel (27.3 KB)Supplementary Table 3.docx
Download MS Word (18.5 KB)Supplementary Table 2.xlsx
Download MS Excel (21.5 KB)Supplementary Table 1.docx
Download MS Word (17.3 KB)Supplementary Table 8.xlsx
Download MS Excel (270.5 KB)Supplementary Table 6.xlsx
Download MS Excel (38.5 KB)Supplementary Table 13.xlsx
Download MS Excel (14.3 KB)Supplementary Table 12.docx
Download MS Word (15.9 KB)Supplementary Table 4.docx
Download MS Word (166.7 KB)Data availability statement
The authors confirm that the data supporting the findings of this study are available within the article. The sequencing data can be accessed in the NCBI SRA (Sequence Read Achieve) database at https://www.ncbi.nlm.nih.gov/sra/PRJNA923388.