Figures & data
Table 1. The sequence of primers and probes.
Figure 1. Workflow chart of identification, selection and verification of biomarkers for detection of HCC. HCC, hepatocellular carcinoma; CLD, chronic liver diseases; WBC, white blood cell; DMC, differential methylation CpG site; DMG, differential methylation gene; ROC, receiver operating characteristic.
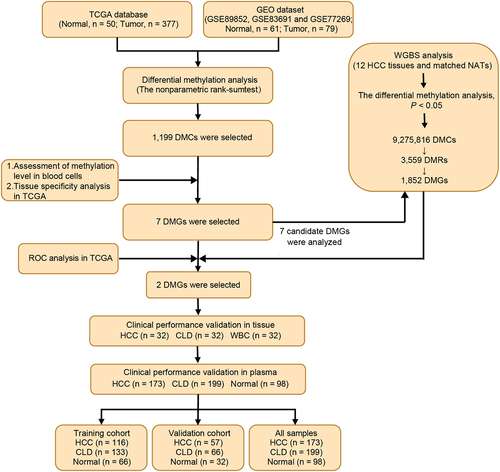
Figure 2. Dmcs identification and selection. a: DMCs heat map in TCGA-LIHC database (normal, n = 50; tumor, n = 377); b: In TCGA-LIHC database, pie chart of the proportion of hypermethylation DMCs and hypomethylation DMCs; c: DMCs heat map in GEO dataset (normal, n = 61; tumor, n = 79); d: In GEO dataset, pie chart of the proportion of hypermethylation DMCs and hypomethylation DMCs; e: Intersection of DMCs between TCGA-LIHC database and GEO dataset; f: The top 30 hypermethylated DMCs with the lowest β value in healthy whole blood samples. Fold change represents the ratio of methylation level of HCC to that of normal samples. The larger the circle, the greater the difference; g: Methylation levels of the 30 hypermethylated DMCs in 32 cancer types of TCGA. ACC, adrenocortical carcinoma; BLCA, bladder urothelial Carcinoma; BRCA, breast invasive carcinoma; CESC, cervical squamous cell carcinoma; CHOL, Cholangiocarcinoma; COAD, colon adenocarcinoma; DLBC, diffuse large B-cell Lymphoma; ESCA, esophageal carcinoma; GBM, glioblastoma multiforme; HNSC, head and neck squamous cell carcinoma; KICH, kidney Chromophobe; KIRC, kidney renal clear cell carcinoma; KIRP, kidney renal papillary cell carcinoma; LGG, brain lower grade Glioma; LIHC, liver hepatocellular carcinoma; LUAD, lung adenocarcinoma; LUSC, lung squamous cell carcinoma; MESO, Mesothelioma; OV, ovarian serous cystadenocarcinoma; PAAD, pancreatic adenocarcinoma; PCPG, pheochromocytoma and Paraganglioma; PRAD, prostate adenocarcinoma; READ, rectum adenocarcinoma; SARC, Sarcoma; SKCM, skin cutaneous Melanoma; STAD, stomach adenocarcinoma; TGCT, testicular germ cell Tumors; THCA, thyroid carcinoma; THYM, Thymoma; UCEC, uterine corpus endometrial Carcinoma; UCS, uterine Carcinosarcoma; UVM, Uveal melanoma.
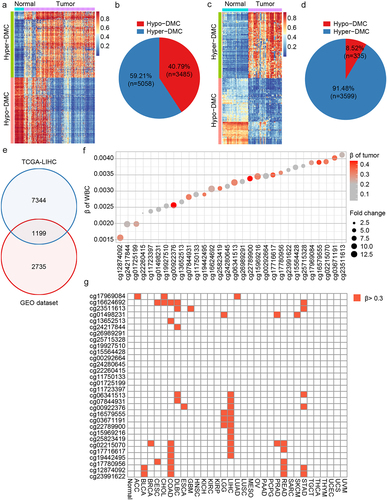
Figure 3. DMC and DMG analyses of WGBS. a: Pie chart of the proportion of hypermethylated and hypomethylated DMCs; b: The distribution of hypermethylated DMCs in different regions of the genome. Downstream, 0–200 bp downstream of the transcriptional start site (TSS); upstream region, 0–2000 bp upstream of the TSS; c: Distribution of hypomethylated DMCs in different regions of the genome; D: correlation of DMCs in TCGA and WGBS in normal tissues; e: Correlation of DMCs in TCGA and WGBS in tumour tissues; f: Methylation level of the seven candidate DMGs in WGBS results.
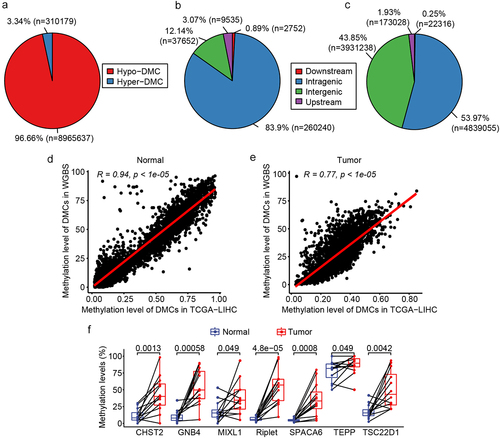
Table 2. ROC analysis of single gene and dual gene panels.
Figure 4. Correlation analysis of the methylation and expression, survival curve analysis of CpG sites methylation of riplet and GNB4 by using TCGA datasets. a: Correlation matrix between methylation level and expression of all CpG sites in riplet gene; b: Correlation matrix between methylation level and expression of all CpG sites in GNB4 gene. The numbers in the circles represented correlation coefficients, with red indicating negative correlation and blue indicating positive correlation; c: Overall survival curves of HCC patients with different methylation levels of the Riplet; d: Overall survival curves of HCC patients with different methylation levels of the GNB4. There was statistic significance when p < 0.05.
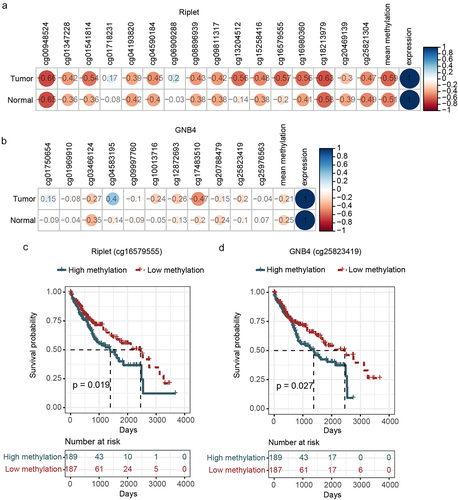
Figure 5. The methylation levels of GNB4 and Riplet were detected in HCC tissues, CLD tissues, and healthy WBC.
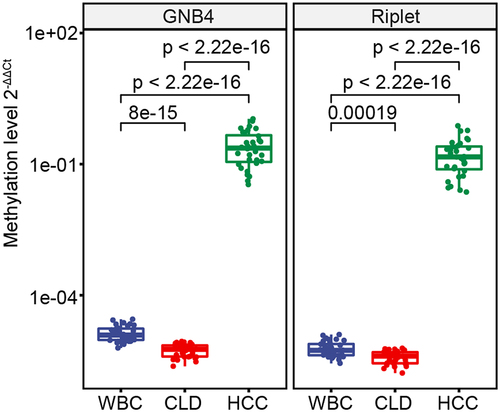
Table 3. Clinical performance of methylated GNB4 and Riplet for detecting HCC in tissue samples.
Table 4. Clinical characteristics of study cohort.
Figure 6. The methylation level of GNB4 and Riplet in all plasma samples.
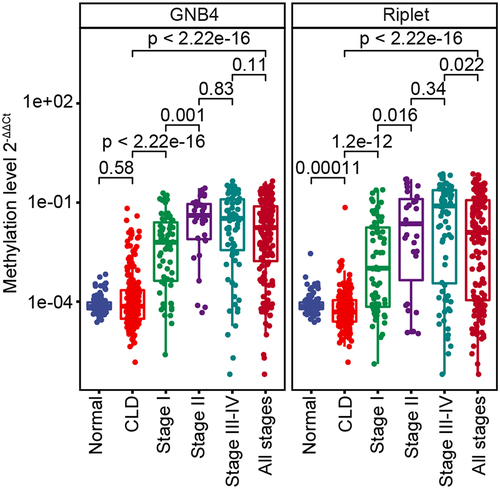
Figure 7. Evaluation of clinical performance of methylated GNB4 and Riplet in blood diagnosis of HCC. a, e, and i were ROC analysis of GNB4, Riplet, and GNB4+Riplet in training cohort, validation cohort and all samples, respectively; b, f, and j: The sensitivity and specificity of GNB4, Riplet, and GNB4 + Riplet in the diagnosis of HCC from non-HCC samples in the training cohort, validation cohort, and all samples were calculated based on the optimal cut-off values determined by ROC analysis; c, g, and k: The sensitivity of GNB4, Riplet, and GNB4 + Riplet to diagnose different stages of HCC in training cohort, validation cohort and all samples; d, h, and l: The specificity of GNB4, Riplet, and GNB4 + Riplet in the diagnosis of HCC in normal individuals and CLD patients in training cohort, validation cohort and all samples.
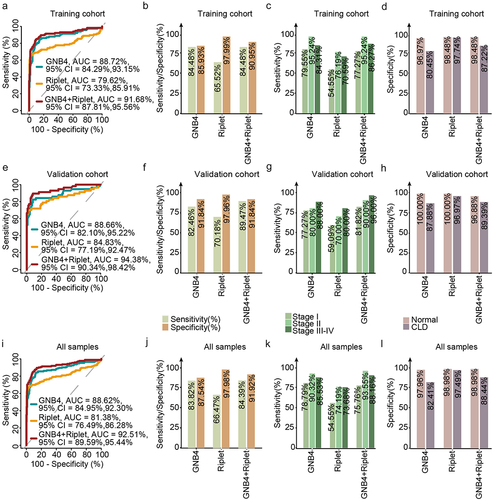
Table 5. Clinical performance of GNB4 combined with Riplet and AFP for HCC.
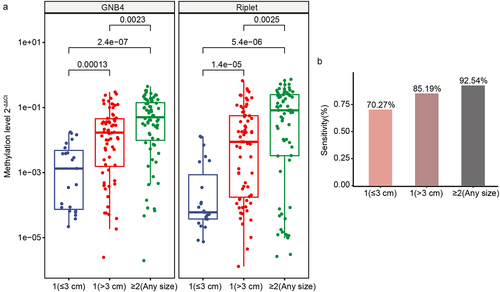
Figure 8. Clinical performance of GNB4 and riplet for different tumour sizes of HCC. a: The methylation level of GNB4 and riplet in different tumour sizes of HCC; b: The sensitivity of GNB4 + riplet to distinguish different tumour sizes of HCC.