
Figures & data
Table 1. Clinical and pathological aspects of penile squamous cell carcinoma participants.
Figure 1. Bisulfite sequencing of H19DMR in penile squamous cell carcinoma. Each row represents a sample (S) and its HPV status (positive samples were considered as p16INK4a+ or hrHPV+). The number of reads is specified for each sample. The SNPs position are specified by the red arrow.
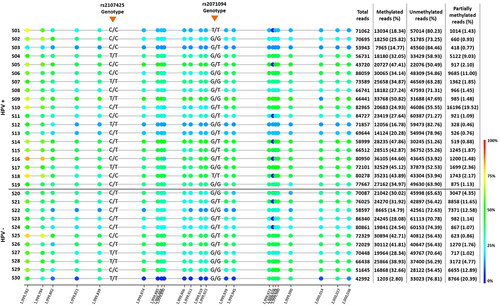
Figure 2. Average of methylated, unmethylated and partially methylated reads in HPV positive (HPV+) and negative (HPV-) of penile squamous cell carcinoma. Positive samples were considered as p16INK4a+ or hrHPV+.
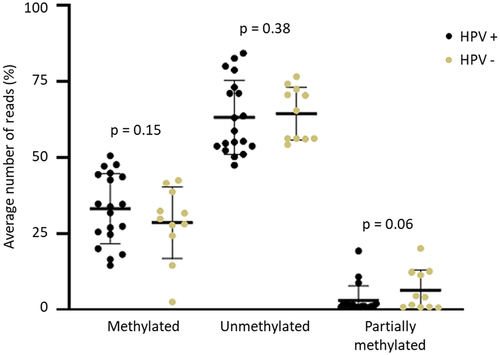
Figure 3. Percentage of methylation for each CpG site in HPV positive (HPV+) and negative (HPV-) of penile squamous cell carcinoma. The CTCF binding site is indicated by the grey arrow. Positive samples were considered as p16INK4a+ or hrHPV+.
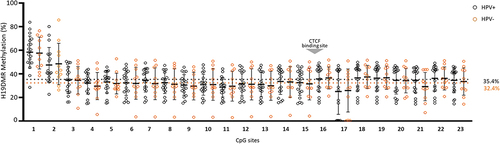
Table 2. Correlation between clinical data of penile squamous cell carcinoma participants and methylation level at H19DMR.
Figure 4. Kaplan – Meier curve for survival probability (n = 27). (a) methylation levels; (b) rs2107425 genotype; (c) s2071094 genotype.
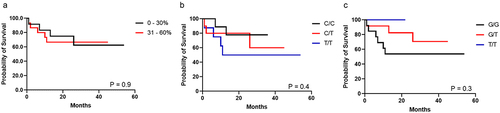
Table 3. Correlation between SNPs genotype (rs2107425 and rs2071094) and H19DMR methylation pattern.
Supplementary Table 1.docx
Download MS Word (21.4 KB)Supplementary Figure 1.tif
Download TIFF Image (64.9 KB)-)Supplementary Table 2.docx
Download MS Word (17.2 KB)-)Supplementary Table 3.docx
Download MS Word (17.3 KB)Data availability statement
Data is available with the authors.