
Figures & data
Table 1. Anthropometric and biochemical parameters of women with PCOS before and after the resistance and aerobic training.
Table 2. Estimation of the difference in clinical and anthropometric parameters of women with PCOS before and after resistance and aerobic exercise.
Figure 1. Average beta values for all probes on the array were compared before and after the implementation of the protocols evidencing an increasing in global DNA before both aerobic exercise (a) and resistance exercise (c). Differential methylation was assessed using paired t-tests for each respective region of the genome. The aerobic exercise (b) increased DNA methylation in global, shores and open sea genomic context, while the resistance exercise (d) increased DNA methylation in all genomic context, including global, islands, shores, shelves and open sea. *designates a p-value of < 0.05, **designates a p-value of < 0.01, and ***designates a p-value of < 0.001. This figure was made with R program version 4.2.2.
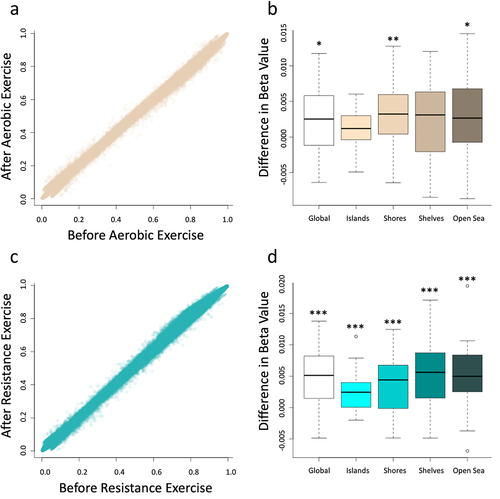
Figure 2. Circos plots display all significantly differentially methylated regions that passed a threshold of FDR > 13 for both aerobic (a) and resistance (c) exercise cohorts. The outer track represents the chromosomes, and the inner track represents the log2 ratio of all differentially methylated regions for both differences that increase following exercise (orange) and decreased following exercise (blue). Additionally, box plots depict the results from the paired sliding window analysis at all sites that were differentially methylated with an FDR > 40 for both the aerobic (b) and the resistance (d) cohorts. The specific location of these regions can be found in . Circular plots were made with RCircos (a package in R version 4.2.2).
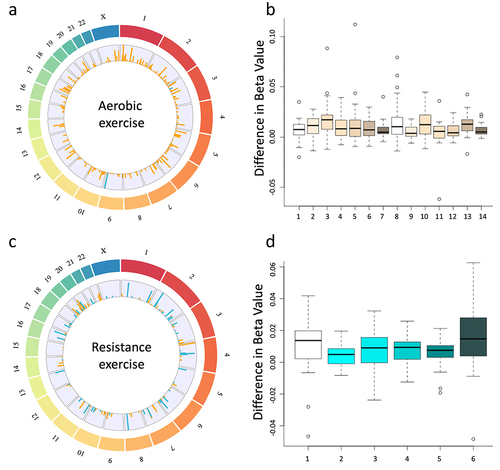
Table 3. Differentially methylated regions as a result of exercise: all regions determined to be altered based on the sliding window analysis are listed. Each site met the basic criteria of FDR of > 40 and a log2 ratio of > 0.2.
Figure 3. Scatter plots depict the accuracy of the Horvath ageing calculator in our cohort of samples for both aerobic (a) and resistance (c) exercise. Boxplots depict the change in predicted age following the exercise regimen for both aerobic (b) and resistance (d). No significant difference was identified for either aerobic (p-value = 0.14) or resistance (p-value = 0.34). This figure was made with R program version 4.2.2.
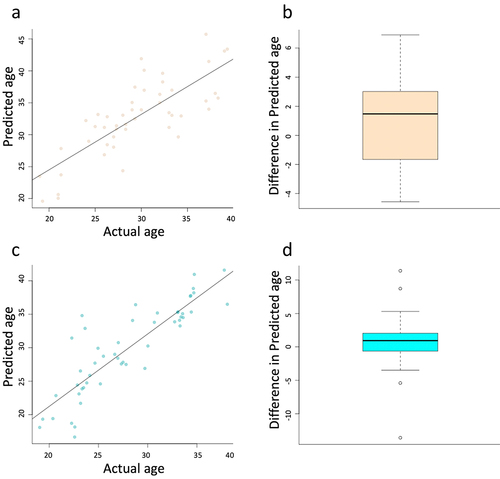
Figure 4. Resistance and aerobic training have different effects on the metabolic, hormonal and body composition of women with PCOS after 16 weeks of intervention [Citation10,Citation11]. The resistance exercise reduces waist circumference, testosterone levels and HDL, while the aerobic exercises reduced waist circumference and testosterone levels. These changes are reflected in epigenetic reprogramming through different exercises, in which the resistance exercises increased average DNA methylation in all CpG island contexts, including global, islands, shores, shelves and open sea and the aerobic exercise increased average DNA methylation across all probes (global), as well as at shores and open sea. This figure was made in part using BioRender (https://biorender.com).
![Figure 4. Resistance and aerobic training have different effects on the metabolic, hormonal and body composition of women with PCOS after 16 weeks of intervention [Citation10,Citation11]. The resistance exercise reduces waist circumference, testosterone levels and HDL, while the aerobic exercises reduced waist circumference and testosterone levels. These changes are reflected in epigenetic reprogramming through different exercises, in which the resistance exercises increased average DNA methylation in all CpG island contexts, including global, islands, shores, shelves and open sea and the aerobic exercise increased average DNA methylation across all probes (global), as well as at shores and open sea. This figure was made in part using BioRender (https://biorender.com).](/cms/asset/65b0552b-631d-4212-bd23-2a4539eb7ee7/kepi_a_2305082_f0004_oc.jpg)
-(Supplemental Material.docx
Download MS Word (1.9 MB)Data availability statement
Data is publicly available at the gene expression omnibus (GEO) under accession number #GSE213366.