
Figures & data
Table 1. Concerted expression changes of HDAC and SIRT genes after drug treatment in the NCI-TPW dataset.
Figure 1. Examples of changes in expression of HDAC genes in response to treatment with erlotinib and dasatinib. Shown are transcriptional changes (log2FC) at 2 (left panel), 6 (middle panel), and 24 hr (right panel) after treatment. Horizontal right bars indicate elevated gene expression, whereas left bars show decreased expression relative to the untreated cell lines. As summarized in , concerted upregulation at 24 hr (shown on the right most panels) was observed for HDAC5 after treatment with (a) the high (2,000 nM) and (b) the low (100 nM) concentrations of dasatinib and (c) the high (10,000 nM) concentration of erlotinib. (d) expression changes of HDAC2 after treatment with the high concentration of dasatinib showed concerted downregulation at 6 hr (middle panel) and 24 hr (right panel). Colors represent cancer categories. The scale on the bottom represents log2 difference between expression values of treated and untreated cell lines. The scale for each microarray experiment is specific to that experiment.
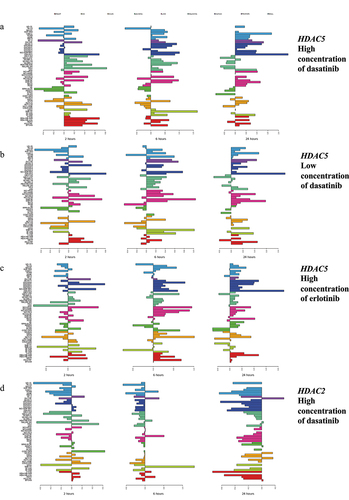
Table 2. Spearman correlations between log(GI50) and log2FC of HDAC and SIRT genes satisfying pFDR <0.05.
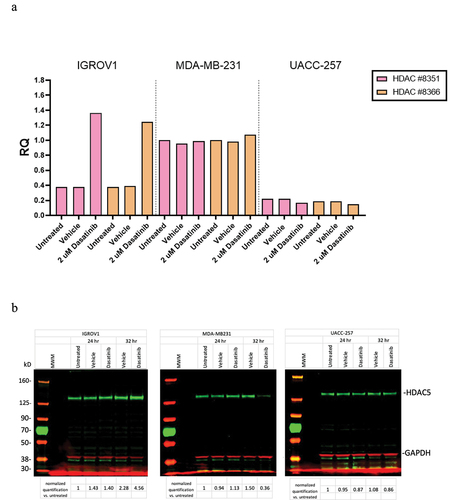
Figure 2. Experimental validation of transcriptional and protein levels of HDAC5 in the IGROV1, MDA-MB-231, and UACC-257 cell lines after treatment with 2000 nM of dasatinib. (a) Transcriptional changes in mRNA levels using RT-PCR. Results of two independent probes to HDAC5 are normalized to GAPDH. (b) Changes in protein levels using Western blots. Protein results are first normalized to GAPDH and then values divided by normalized untreated cells. Full blots are shown.
Supplemental Material
Download Zip (3.7 MB)Data availability statement
The datasets analysed in the current study are publicly available from the NCI-TPW portal, [https://tpwb.nci.nih.gov] [Citation33] (NCI-TPW drug response data, gene expression changes, and baseline gene expression data and their graphical presentation) and NCBI GEO, [https://www.ncbi.nlm.nih.gov/geo/] (public datasets used for validation of HDAC and SIRT and miRNA expression changes in response to drug treatment). The dataset of mRNA and protein changes of HDAC5 in the IGROV1, MDA-MB-231, and UACC-257 cell lines in response to dasatinib used during the current study is available from the corresponding author on reasonable request.