
Figures & data
Figure 1. Intersection schema between data. schematic workflow of how we intersected the data in our analysis. The intersection of all three data types with ChIP-seq data (CG motif ∩ WGBS ∩ array ~ ChIP) is the primary analysis presented in this manuscript and shown in . This narrow view is then expanded by increasing the genomic region associated with each predicted transcription factor binding site ().
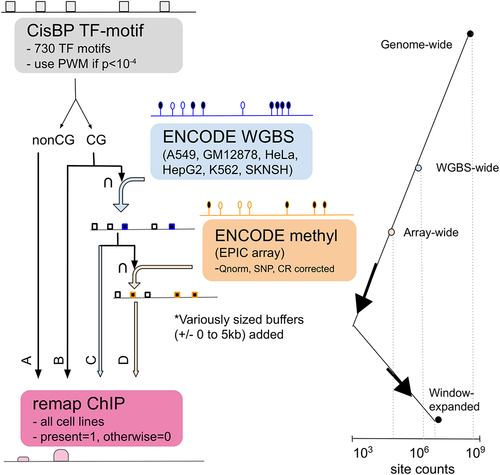
Figure 2. AUROC comparisons across cell lines and genomic annotations. (a) Boxplots representing the distribution of TF AUROC scores for each cell line. All AUROCs improve using methylation-based scoring compared to PWM-based scoring at a significance level of p < 2×10⁻³. AUROC scores for individual TFs are shown in figure S5. (b) Boxplots representing the distribution of TF AUROC values when assessed within different genomic regions, indicating that the overall improvement in predicting TF binding can be attributed to region-specific improvement. figure S6 has TF specific breakdowns. (c) Boxplots representing the distribution of TF AUROC values when assessed in the context of gene regulatory regions, indicating that the overall improvement in predicting TF binding can be attributed to improvements in or near the TSS. Note that the ExonBnd has an order of magnitude less associated motif locations. 0 refers to unlabelled. figure S7 has TF specific breakdowns. figure S8 includes additional predictions in the context of CpG islands and promoters. pwm = PWM (position weight matrix); me=methyl array; wg=WGBS.
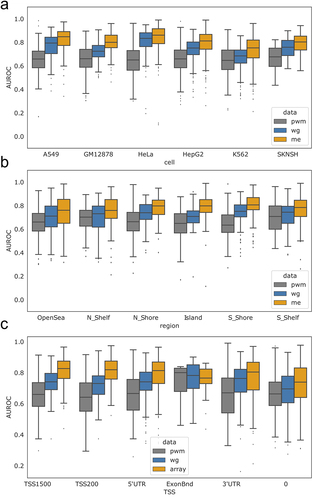
Figure 3. Performance of individual TFs in different genomic regions. (a) Performance of PWM-based scoring for each TF and cell line (each point is a unique TF/cell line combination), compared to scoring based on methylation type (WGBS or methylation array) and genomic context (gene body or promoter). Solid red lines at 0.5 are displayed to highlight TFs with no methylation associated signal. A dotted red line at 0.75 is plotted along the methylation-specific y-axis. Several CEBP family members lie below 0.5 AUROC and are listed in supplemental figure S7F. (b) Performance of PWM-based scoring for each TF (each point is a unique TF), compared to the performance based on methylation type (WGBS or methylation array) and genomic context (gene body or promoter). The colour of the circles indicates whether the TF belongs to the MethylMinus (blue) or MethylPlus (yellow) class as defined in yin et al. In contrast to (a), in these plots each point is a unique TF averaged across cell lines to match cell line agnostic labels from yin et. al.
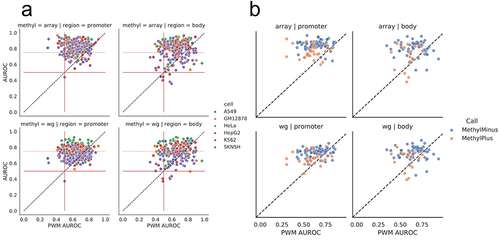
Table 1. Counts of intersecting regions across omics. While generally on the same order of magnitude, all cell lines have a slightly different number of assessed regions (motif locations) across the various omics. Intersecting the regions available for each of the omics determines the number of transcription factors and motif locations assessed in our analyses. Rows in which the first column (row title) is bolded indicate the number of elements (TF locations) being assessed; other rows show the median AUROC across all the TFs evaluated in a cell line. The letters in the first column of this table references .
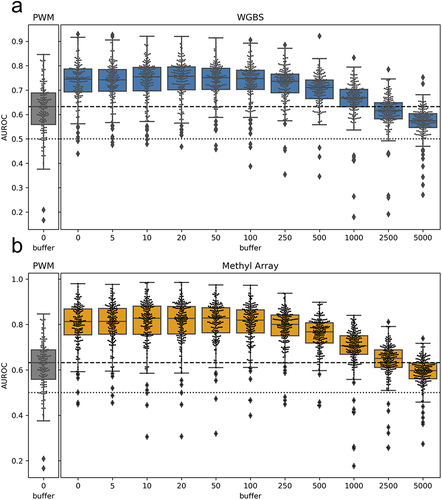
Figure 4. Performance when using nearby CpGs to score motif locations: boxplots representing the distribution of all TF AUROC scores in all cell lines when the methyl-score is derived from nearby CpGs. The x-axis indicates the window (or buffer) around the motif locations that was used. A buffer of 0 indicates direct overlap of CpG sites with the motif locations, as was done for the analyses shown in . We observe similar performance up to a window size of about ± 100bp, after which there is a drop-off in predictive performance. figure S9 shows that the average difference in methylation levels for pairs of CpGs within a given range has a complementary pattern as what we observe here.
Supplemental_Material_Methods_and_Figures_12112023.pdf
Download PDF (1.7 MB)TableS1_TF_AUCvals_Table.xlsx
Download MS Excel (18.6 KB)Data availability statement
All data used in this paper are publicly available. Locations where the data can be downloaded and accession numbers are provided in the Supplemental Material.