
Figures & data
Figure 1. The association between the PIM score and the tumor immune microenvironment. (a). The bubble plot shows different correlations in GBM (upper) and LGG (bottom) samples from TCGA. The immune score, stromal score, and tumor purity were assessed by the ESTIMATE algorithm [Citation32]. (b). The charts show the correlation degree (see methods) between the PIM score corresponding to different intermediate methylation levels and cell marker expressions in various cell types (table S2). A higher correlation degree indicates a stronger association between marker gene expressions and intermediate methylation levels. The range of correlation degrees at different intermediate methylation levels is larger, and the color bar is deeper. (c). The tumor immune microenvironment consists of multiple cell types (left, created with biorender.com, https://biorender.com/). The distributions of DNA methylation profiles varied in single cell type and tumor bulk samples (right, single cell type shows 0% or 100% methylation status, intermediate methylation level was higher in tumor tissue). The lollipop plot shows glioma tumor tissue had the highest intermediate methylation level.
![Figure 1. The association between the PIM score and the tumor immune microenvironment. (a). The bubble plot shows different correlations in GBM (upper) and LGG (bottom) samples from TCGA. The immune score, stromal score, and tumor purity were assessed by the ESTIMATE algorithm [Citation32]. (b). The charts show the correlation degree (see methods) between the PIM score corresponding to different intermediate methylation levels and cell marker expressions in various cell types (table S2). A higher correlation degree indicates a stronger association between marker gene expressions and intermediate methylation levels. The range of correlation degrees at different intermediate methylation levels is larger, and the color bar is deeper. (c). The tumor immune microenvironment consists of multiple cell types (left, created with biorender.com, https://biorender.com/). The distributions of DNA methylation profiles varied in single cell type and tumor bulk samples (right, single cell type shows 0% or 100% methylation status, intermediate methylation level was higher in tumor tissue). The lollipop plot shows glioma tumor tissue had the highest intermediate methylation level.](/cms/asset/cadfaac2-8426-4537-ad2b-631a4aab7d85/kepi_a_2318506_f0001_oc.jpg)
Figure 2. Intertumoral DNA methylation heterogeneity characterizing NMF subtypes. (a). The correlation between DNA methylation heterogeneity and tumor purity (Spearman’s rank correlation coefficient). (b). Using non-negative matrix factorization, GBM and LGG samples from TCGA were classified as three tumor immune microenvironmental subtypes (NMF subtypes). (c). The DNA methylation heterogeneity differed between NMF subtypes (Wilcoxon signed-rank test, P-values*** < 0.001, P-values** < 0.01, P-values* < 0.05). (d). The bubble plot demonstrates the CV values of the cellular enrichment ssGSEA score across NMF subtypes. (e). The line chart shows the CV values in DNA methylation heterogeneity, DNA methylation level, and cellular enrichment score in all glioma patients before clustering and in patients within the same NMF subtypes. (f). 90.18% of NMF-2 samples were enriched in isocitrate dehydrogenase (IDH) mutant status and 89.47% of NMF-2 samples were enriched in O-6-methylguanine-DNA methyltransferase (MGMT) promoter methylation status (hypergeometric test-P < 0.001).
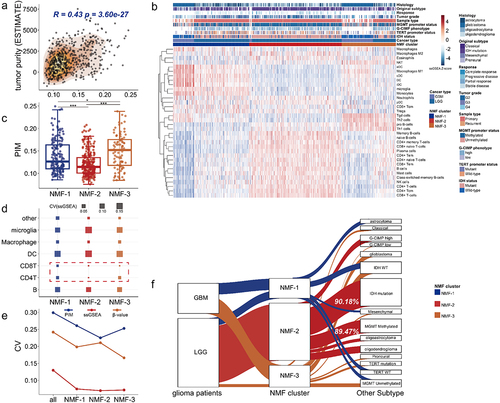
Figure 3. DNA methylation heterogeneity is related to clinical variables of GBM and LGG patients from TCGA. (a). The distribution of PIM scores differed among NMF subtypes (Kruskal-Wallis test, P-value*** < 0.001). (b). The line chart shows the number distribution of glioma patients with different PIM scores among NMF subtypes. (c). The forest plot shows the prognostic value of the PIM score based on cox regression analysis. (d). The numbers of GBM and LGG samples from TCGA correspond to IDH status, MGMT promoter status, TERT promoter status, histological subtype, original subtype, G-CIMP phenotype, tumor grade, and sample type. The box plots show the PIM scores in (e) different glioma phenotypes, tumor grades, (f). Patients with different disease progression after Temozolomide treatment, and (g). Different patients treated with different drug therapies (Wilcoxon signed-rank test, P-values*** < 0.001, P-values** < 0.01, P-values* < 0.05). (h), the bar plots display the distribution of PIM scores for patients who received chemotherapy. For the responder (complete response and partial response), the proportions of high-PIM, low-PIM, and medium-PIM are 23.81%, 33.33%, and 42.86%, for non-responders (progressive disease and stable disease), the proportions of high-PIM, low-PIM, and medium-PIM are 39.25%, 31.78%, and 28.97% (Wilcoxon signed-rank test, P-values*** < 0.001).
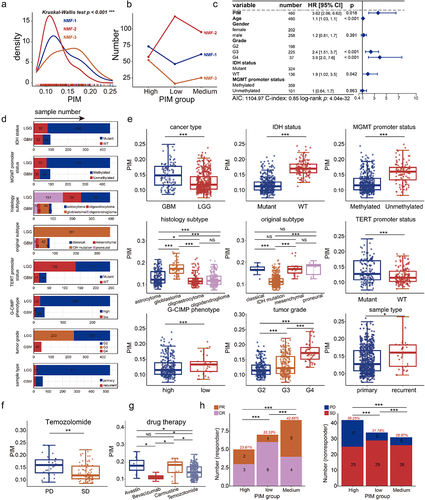
Figure 4. Cell-type-associated heterogeneous CpG sites correlate with genes regulating the proliferation and differentiation of T-lymphocyte. (a). Identification of cell-type-associated heterogeneous CpG site (CpGct) and the construction of CMHC score. (b). The barplot shows the number and genome distribution of cell-type-associated CpG sites (hypermethylation refers to the mean DNA methylation level of the given CpG site in cell-type a is higher than in other cell types, while hypomethylation refers to the mean DNA methylation level of the given CpG site in cell-type a is lower than in other cell types). (c). The box plots show the correlation degrees in different cell types calculated based on CMHC and methylCIBERSORT. DNA methylation reference matrix (M) consists of CpGct, which was used in the deconvolution for the CMHC model. (Wilcoxon signed-rank test, P-values*** < 0.001, P-values** < 0.01, P-values* < 0.05). Enrichment of (d). GO terms and (e). KEGG pathways associated with DEGs. GO terms include biological process (BP), molecular function (MF), and cell component (CC).
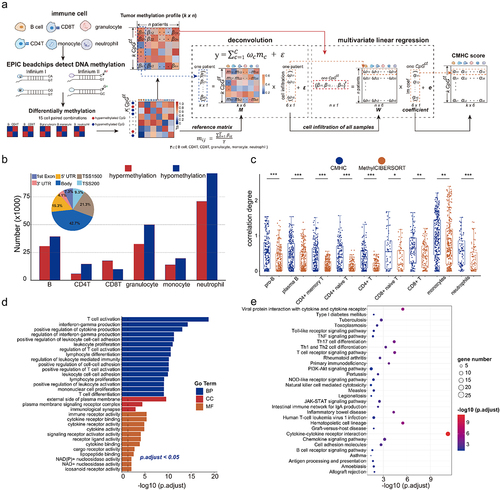
Figure 5. Cell-type-associated heterogeneous CpG sites were enriched in neural-related biological processes. (a). The construction of CMHCcell score. (b). Prognosis-related CpG sites and CpGct were identified by cox regression and Kaplan-Meier (KM) analysis with the log-rank test (P-values < 0.05). (c). The stack bar plots show different DNA methylation patterns of CpGct. (d). The stack bar plots show the distributions of different genome regions for CpG sites and CpGct. (e). Kaplan-Meier (KM) analysis shows the prognostic value of the CMHCcell score in TCGA, GSE103659, and GSE60274. (f). The line charts display the distributions of β-values and the CMHCcell score for 83 prognosis-related CpGct. (g). The negative correlation between gene expressions and DNA methylation levels of CpGct located in the gene promoter (Spearman’s rank correlation coefficients). GO enrichment of EWAS for (h). 94 CpG sites and (i). 83 CpGct.
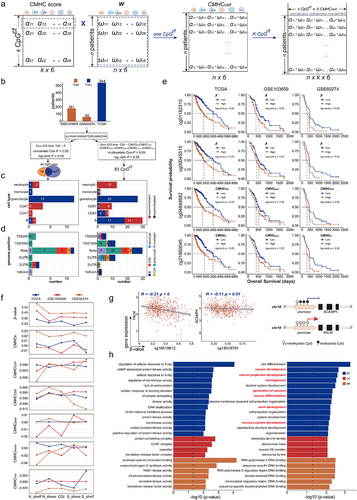
Figure 6. The prognostic value of CHMC score and CMHR score. (a). The construction of the CMHR score. (b). Kaplan-Meier (KM) analysis showed that low-risk patients had poor survival outcomes (training data: TCGA, and testing data: GSE103659 and GSE60274). (c). For TCGA samples, the forest plot shows the CMHR score is a prognostic factor independent of the age, gender, tumor grade, MGMT promoter status, and IDH status of glioma patients. For GSE103659 and GSE60274, the CHMR score is independent of the age and MGMT promoter status of glioma patients. (d). Oncoplots show the mutation genes differed in high-risk and low-risk patients, there were nine genes overlapped in both groups including IDH1, TP53, ATRX, TTN, RYR2, PIK3CA, MUC16, CIC, and FUBP1. High-risk patients include 221 LGG samples and 40 GBM samples, while low-risk patients contain 266 LGG samples and 2 GBM samples. (e). The expression differences of mutation genes between high- and low-risk patients. For genes mutated more frequently in the high-risk group, there were 4 out of 15 genes (26.67%) with greater expressions in high-risk patients, and there were 5 out of 15 genes (33.33%) expressed higher in low-risk patients. For genes mutated more frequently in the low-risk group, there were 11 out of 16 genes (68.75%) with higher expressions in low-risk patients, and there were 3 out of 16 genes (18.75%) expressed higher in high-risk patients. The protein expression levels of (f) EGFR and (g) PCLO were checked from the human protein atlas (https://www.Proteinatlas.org/humanproteome/pathology).
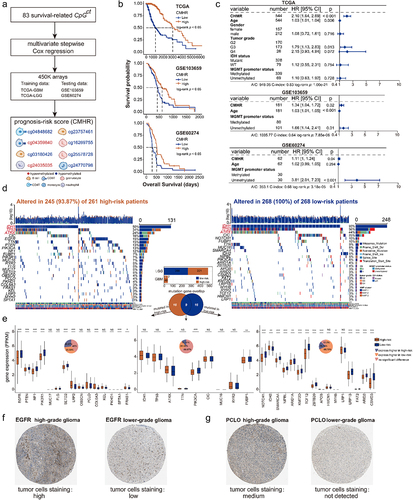
Figure 7. CMHR score was related to cytotoxic T-lymphocyte infiltration. (a). The featured genes associated with T-lymphocyte infiltration were collected from the molecular signatures database (MsigDB), Kyoto Encyclopedia of genes and genomes (KEGG), and gene ontology (GO). By performing the log-rank test and Cox-wald test, these featured genes were related to the overall survival of GBM and LGG samples from TCGA. These featured genes were positively correlated with the CMHR score as well as the cytotoxic score (Spearman’s rank correlation coefficients). (b). Featured genes were involved in anti-tumor immunity and tumor killing (MHC: major histocompatibility complex, TCR: T cell receptors). (c). The association between prognosis-related CpGct and featured genes in low-risk (upper) and high-risk (bottom) patients (Spearman’s rank correlation coefficients). (d). The box plots show the expressions of featured genes in high- and low-risk patients (Wilcoxon signed-rank test, P-values*** < 0.001). (e). The associations of the CMHR score with tumor purity, immune cell infiltration, stromal cell infiltration levels, and the percent of aneuploidy (Spearman’s rank correlation coefficients). The box plot shows the cytotoxic score in high- and low-risk patients (Wilcoxon signed-rank test, P-values*** < 0.001). (f). For GBM and LGG samples from TCGA, the receiver operating characteristic curves (ROC) show the CMHR score was more predictive for overall survival, IDH status, MGMT promoter status, and histological phenotypes. The predictive potential was measured by the area under curves (AUC). (g). For GBM and LGG samples from TCGA, the bar plots show the values of CMHR score, cytotoxic score, GZMA expression, and PRF1 expression in different histological phenotypes (Kruskal-Wallis test, P-value*** < 0.001), IDH status, and MGMT promoter status (Wilcoxon signed-rank test, P-values*** < 0.001). For GSE103659 and GSE60274, the CMHR score differed between MGMT promoter methylation and unmethylation status (Wilcoxon signed-rank test, P-values*** < 0.001).
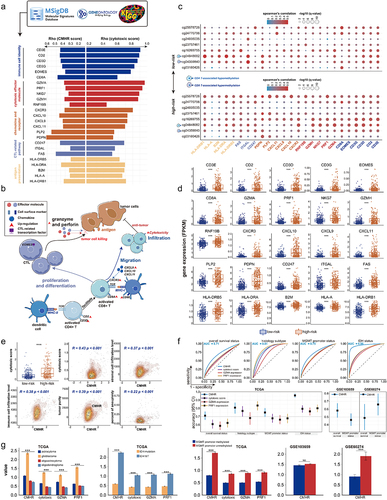
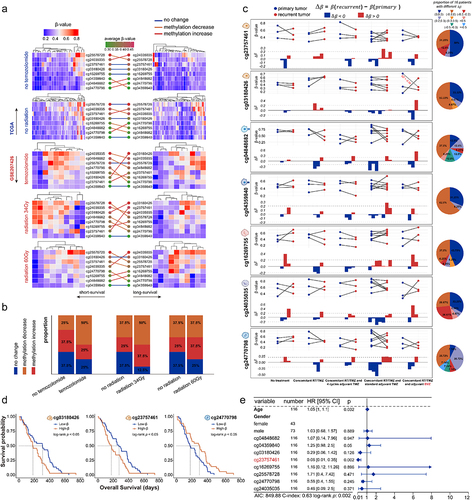
Figure 8. The correlation between DNA methylation level of prognosis-related CpGct and the drug therapies. (a). Heatmaps show the DNA methylation changes of prognosis-related CpGct in short-survival and long-survival glioma patients (TCGA and GSE207426). (b). The bar plots show the proportion of CpGct with different methylation changes between patients receiving Temozolomide and radiation as well as TCGA patients without treatment. (c). Line charts show the DNA methylation changes of prognosis-related CpGct for 19 GBM patients with primary and paired recurrent tumors (GSE85087), and 16 patients received different treatments. The pie plots show the proportion of 16 patients with different values.
, DNA methylation levels of CpGct were higher in recurrent tumors;
, DNA methylation levels of CpGct were lower in recurrent tumors. TMZ represents the drug Temozolomide, and BVZ means the drug Bevacizumab. The more species of Δβ in the pie chart, the higher DNA methylation heterogeneity. (d). Kaplan-Meier (KM) analysis shows the prognosis value of B cell-related CpGct and monocyte-related CpGct in GBM patients accepting radiation (GSE195684). (e). The forest plot shows that the DNA methylation level of B cell-related CpGct was a prognostic factor independent of the age, gender, and DNA methylation levels of other CpGct (GSE195684).
-)Revised Supplement figures.docx
Download MS Word (4.1 MB)Supplementary tables.xlsx
Download MS Excel (23.9 MB)Data availability statement
The datasets analysed during the current study are available in the TCGA database; https://www.cancer.gov/tcga/, GEO repository; https://www.ncbi.nlm.nih.gov/geo/, and Xena browser: https://gdc.xenahubs.net. Accession numbers in GEO have been described in the section ‘Materials and Methods’ and Table S1. And custom analysis scripts are available at https://github.com/ShuangyueMa/DMH_glioma.