
Figures & data
Figure 1. Strain-specific differences in Ankrd26 expression and methylation. (a) Comparison of the expression of Ankrd26 in 129Sv and B6 mEscs. Y-axis represents normalized RNA-seq gene-level counts quantified with the DESeq2 pipeline. The p-value was calculated by the DESeq2 pipeline, which uses the Wald test to compare expression between groups. (b) Schematic diagram of the Ankrd26 locus from the mm10 genome build which displays the Ankrd26 TSS and 5’UTR, the Ankrd26-targeted guide RNA (gRNA) used by Takahashi et al., two flanking CpGs which are present on the Infinium Mouse Methylation Array, and all CpGs in the region. (c) Methylation levels of cg43906169 (left) and cg43906198 (right) from the Infinium Mouse methylation Array in matched 129Sv-B6 pairs. (d) Same as (c) except matched pairs are separated by tissue. For (c) and (d) p-values were calculated by paired-tests (c) or multiple-paired t-tests with adjustment for multiple testing by the FDR method (D). ns indicates no statistically significant difference, *indicates p < 0.05, **indicates p < 0.01, and ****indicates p < 0.0001.
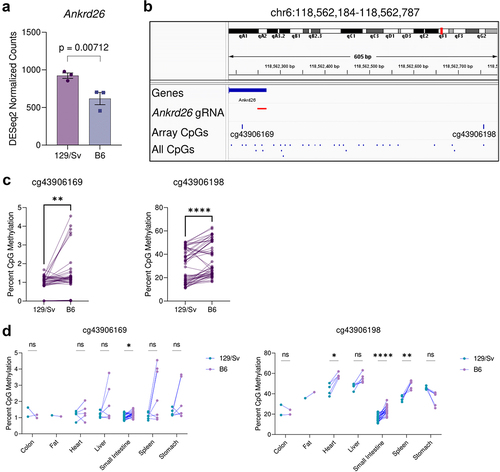
Figure 2. Indels in predicted CRISPR/Cas9 off-target regions in the edited HR1ex clone. All underlying data is provided in supplementary table 1. The blue line indicates the observed number of INDELs that are unique to HR1ex clone which occur in predicted off-target regions given the number of mismatches (MM), NGG or NRG PAM, and either no bulge or a 1-bp bulge between the gRNA and off-target site, indicated above each graph. Bars represent mean ± SEM of the number of unique HR1ex indels that occur in an equal number of equally sized random regions in the same clone with 5 independent randomizations (random condition) or the mean ± SEM of the number of WT INDELs (for which a number of INDELs equal to HR1ex unique INDELs were randomly selected 5 times from all WT INDELs) in the same predicted off-target regions (WT condition). Values were compared against the observed HR1ex INDEL count with a one-sample t-test. *indicates p < 0.05, **indicates p < 0.01, ***indicates p < 0.001, and **** indicates p < 0.0001.
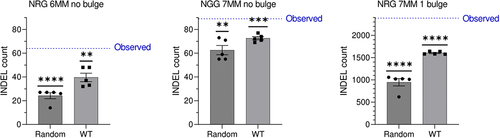
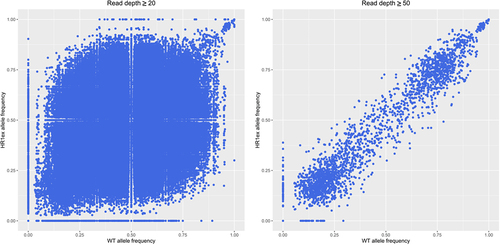
Figure 3. Altered allele frequencies in WT and HR1ex clones. Scatter plots of all alternate allele frequency at all positions with a minimal read depth of 20 (left) or 50 (right).
Supplementary_File_1.xlsx
Download MS Excel (11.2 KB)-)Supplementary_Info.docx
Download MS Word (1.1 MB)Data availability statement
There was no original data generated in this study.