
Figures & data
Figure 1. Development of a mouse model to study the effects of heavy smoking. (a) Adult female mice (N = 16 control, N = 16 CS) were exposed to heavy doses of whole-body CS for 9 weeks, from a pre-pregnancy period of 3 weeks and ending 3 weeks after birth of offspring. 15 of these had their litters within one week of each other and were included in this study. Following lung function measurements, tissues were collected from dams 48 hours after the last day of 9 weeks of smoke exposure and then 15 weeks after smoking cessation. (b) Dam cotinine levels measured in plasma 48 hours and 15 weeks after smoking cessation. N = 5 per group. Differences in plasma cotinine were analysed using student t-tests.
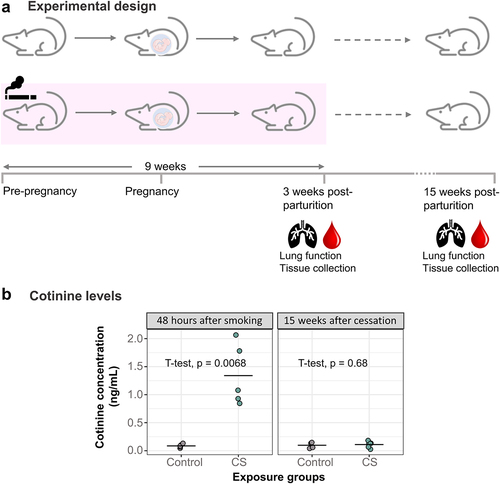
Figure 2. Smoke exposure causes transient changes to immune cell infiltration into dam lungs, but does not alter dam baseline lung function over time. (a) Total immune cells per mL lavage immediately after smoking and 15 weeks after smoking cessation. (b) Eosinophils per mL lavage in the CS-exposed dams (mean = 7528, SD = 3736) was over 4 times more elevated than control dams (mean = 1569, SD = 1029) immediately after smoking, but normalized to controls 15 weeks after smoking cessation. (c) Macrophages per mL lavage immediately after smoking and 15 weeks after smoking cessation. (d) Lymphocytes per mL lavage in the CS-exposed dams (mean = 5680, SD = 2357) was over 8 times elevated compared to control dams (mean = 649, SD = 256) immediately after smoking, but normalized to controls 15 weeks after smoking cessation. (e) Total lung resistance at baseline. (f) Airway resistance at baseline. (g) Tissue resistance at baseline. (h) Alveolar elastance at baseline. N = 4–6 per group. Differential cell counts were normalized to lavage volume. Lung function values were measured using 90th percentile values after injection of saline into the lungs. Two-group comparisons were conducted using a student t-test and p < 0.05 was considered significant.
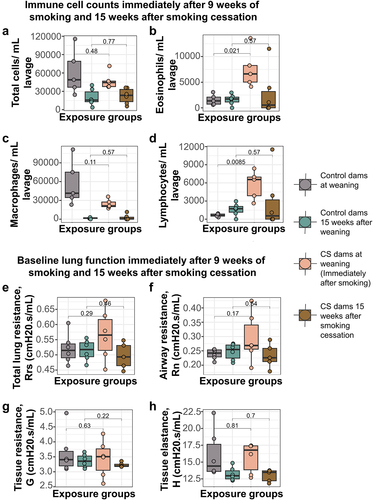
Figure 3. Smoke exposure alters methacholine responsiveness in mouse lungs up to 15 weeks after smoking cessation. (a) Total lung resistance immediately after smoking. (b) Airway resistance immediately after smoking. (c) Tissue resistance immediately after smoking. (d) Alveolar elastance immediately after smoking. (e) Total lung resistance after 15 weeks of smoking cessation. (f) Airway resistance after 15 weeks of smoking cessation. (g) Tissue resistance after 15 weeks of smoking cessation. (h) Alveolar elastance after 15 weeks of smoking cessation. N = 5–6 per group. Lung function values were measured using 90th percentile values upon administration of increasing doses of methacholine. Data was analyzed using one-way ANOVA, followed by multiple comparisons at each methacholine dose where significant. *p < 0.05 in control vs smoke-exposed group.
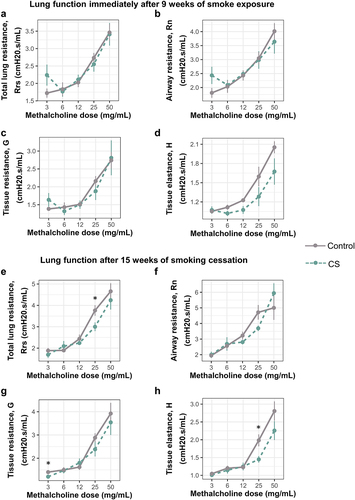
Figure 4. Cyp1a1 and Ahrr DNAm and expression levels in dam blood and lungs immediately after smoking and 15 weeks after smoking cessation. (a) Cyp1a1 DNAm in dam blood 15 weeks after smoking cessation. (b) Cyp1a1 expression in dam lungs 15 weeks after smoking cessation. (c) Cyp1a1 DNAm in dam lungs immediately after 9 weeks of smoking (d) Cyp1a1 DNAm in dam lungs 15 weeks after smoking cessation. (e) Ahrr DNAm in dam blood after 15 weeks of smoking cessation. (f) Ahrr DNAm in dam lungs after 15 weeks of smoking cessation. (g) Ahrr expression in dam lungs after 15 weeks of smoking cessation. N = 2–5 per group. Differences in DNAm and expression were analysed using student t-tests.
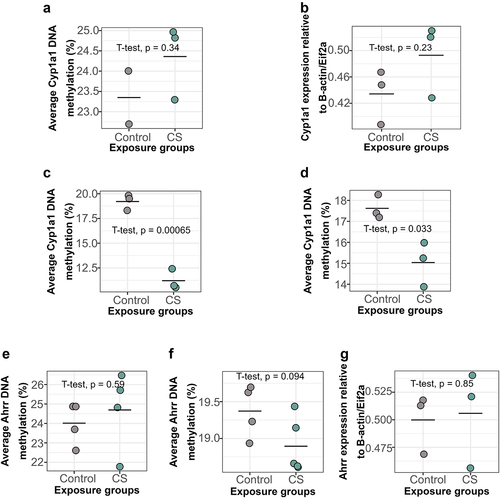
Table 1. CpGs significantly altered immediately after exposure to CS for 9 weeks. Linear regression was computed using LIMMA, after adjusting for one surrogate variable recommended by SVA (see Figure S1).
Table 2. List of significantly enriched biological pathways/processes immediately after 9 weeks of smoking.
Figure S4_dam paper.tif
Download TIFF Image (2.2 MB)Table S1_Sample information.xlsx
Download MS Excel (10.2 KB)Figure S2_Cyp1a1_Gviz_dam paper.tif
Download TIFF Image (2 MB)Figure S3_dam paper.tif
Download TIFF Image (1.7 MB)Figure S1_dam paper.tif
Download TIFF Image (1.9 MB)Data availability statement
The data supporting the findings from this study are available from the corresponding author, M.J.J., upon request.