
Figures & data
Figure 1. Manhattan plot of the EWAS for cumulative psychosocial stress in HRS. The red horizontal line indicates the epigenome-wide significance threshold (FDR q < 0.10).
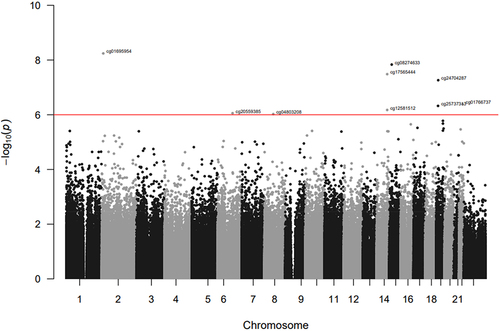
Table 1. Characteristics of the health and retirement study analytic sample (N = 2,689).
Figure 2. Quantile-quantile plot of the EWAS for cumulative psychosocial stress in HRS (inflation factor λ = 1.09).
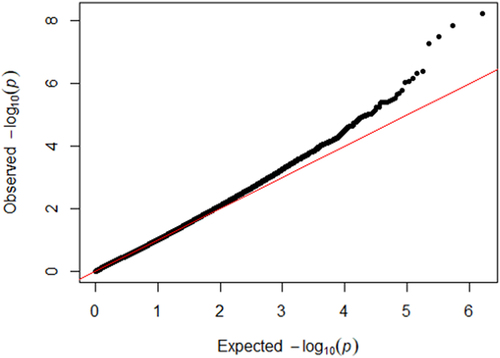
Table 2. Significant CpG sites from the epigenome-wide association study (EWAS) of cumulative psychosocial stress (Model 1: FDR q < 0.10).
Opsasnick StressEWAS SuppTables Revised.docx
Download MS Word (161.4 KB)Data availability statement
The data used in this study are available from the Health and Retirement Study (HRS), conducted at the University of Michigan. These data are available to registered users who meet security requirements and agree to data use conditions specified by the HRS (https://hrsdata.isr.umich.edu/data−products/).