
Figures & data
Table 1. Primer sequences.
Table 2. The information of antibodies.
Figure 1. ICH altered the expression pattern of m6A readers in the brain tissues of rats. (a,b) The expressions of YTHDF1, YTHDF2, YTHDF3, YTHDC1, YTHDC2, IGF2BP1, IGF2BP2, and IGF2BP3 in brain tissues of rats were analyzed by qRT-PCR and Western blot. n = 3. (c) The expressions of YTHDC2 and NeuN in the neuronal cells of rats were identified by if staining. n = 3. (d) The expressions of YTHDC2 and GFAP in the astrocytes of rats were identified by if staining. n = 3. (e) The expressions of YTHDC2 and IBA1 in the microglia of rats were identified by if staining. n = 3. *p < 0.05 vs. Sham.
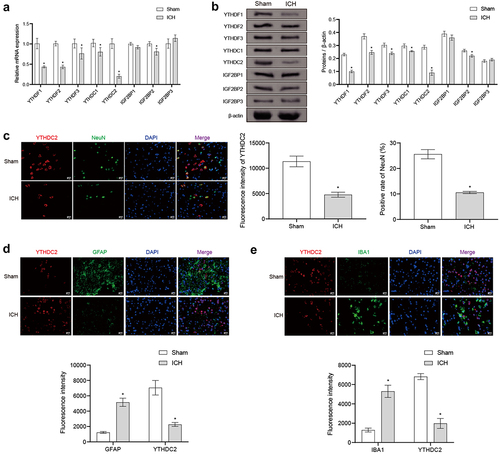
Figure 2. Regulation of YTHDC2 affected brain injury in ICH rats. (a) mNSS score. n = 10. (b) The water content of the contralateral brain, ipsilateral brain, and cerebellum. n = 3. (c The morphological changes in brain tissues were observed by H&E staining. n = 3. (d) The distribution and morphology of neuronal cells were analyzed by Nissl staining. n = 3. *p < 0.05 vs. Sham, #P < 0.05 vs. ICH+oe-NC.
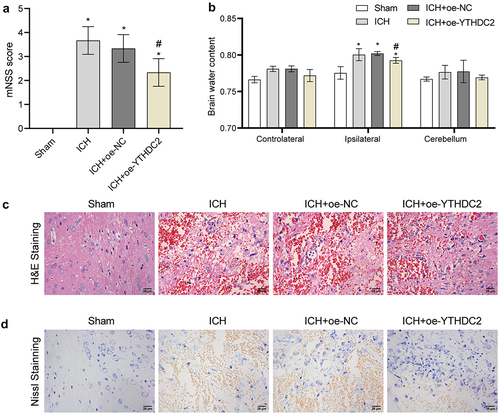
Figure 3. YTHDC2 affected ferroptosis and expression of ferritinophagy-related protein NCOA4 in ICH rats. (a) Iron deposition in brain tissues was detected by Prussian blue staining. n = 3. (b,c) Lipid ROS levels in brain tissues were analyzed by flow cytometry. n = 4. (d,e) Levels of MDA, GSH, and Fe2+ in serum were measured by biochemical kits. n = 4. (f) The expressions of NCOA4, FTH, FTL, PTGS2, and ATG5 in brain tissues were assessed by Western blot. n = 4. *p < 0.05 vs. Sham, #P < 0.05 vs. ICH+oe-NC.
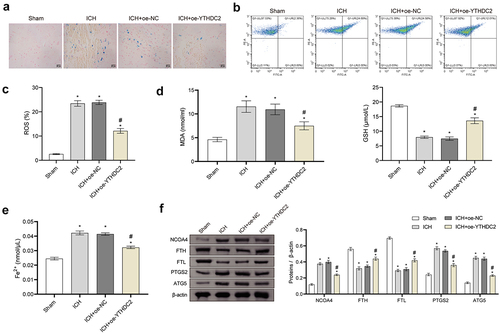
Figure 4. YTHDC2 affected neuronal injury through ferritinophagy-related ferroptosis. (a) The viability of neuronal cells was evaluated by CCK-8 assay. n = 3. (b,c) Levels of lipid ROS in neuronal cells were measured by flow cytometry. n = 3. (d,e) MMP in neuronal cells was determined by the JC-1 method. n = 3. (f,g) Levels of MDA, GSH, and Fe2+ in neuronal cells were evaluated by biochemical kits. n = 3. (h) The expressions of NCOA4, FTH, FTL, PTGS2, and ATG5 in neuronal cells were evaluated by Western blot. n = 3.*p < 0.05 vs. Control, #P < 0.05 vs. Hemin+oe-NC, &p < 0.05 vs. Hemin+oe-YTHDC2.
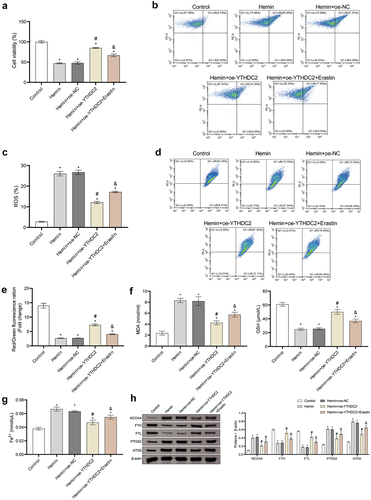
Figure 5. YTHDC2 bound to NCOA4 mRNA and affected its stability. (a) The binding of YTHDC2 and NCOA4 mRNA was verified by RIP-qPCR. n = 3.*p < 0.05 vs. IgG. (b) The stability of NCOA4 mRNA was analyzed by RT-qPCR. n = 3. *p < 0.05 vs. Control, #P < 0.05 vs. Hemin+oe-NC.
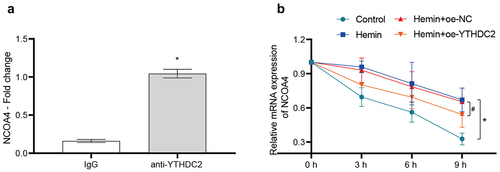
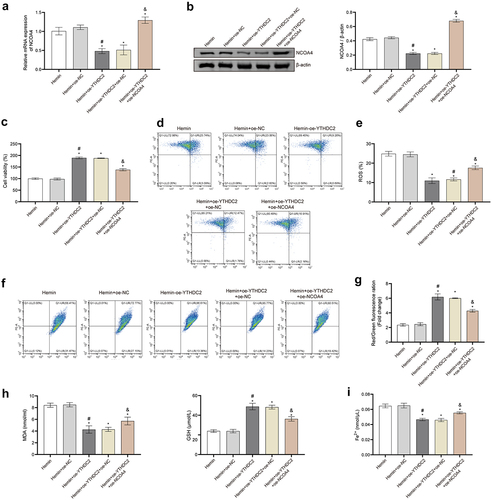
Figure 6. Regulation of NCOA4 reversed the effect of YTHDC2 on hemin-induced neuronal ferroptosis. (a,b) The expression of NCOA4 in neuronal cells was detected by RT-qPCR and Western blot. n = 3. (c) The viability of neuronal cells was evaluated by CCK-8 assay. n = 3. (d,e) levels of lipid ROS in neuronal cells were analyzed by flow cytometry. n = 3. (f,g) MMP in neuronal cells was determined by the JC-1 method. n = 3. (h,i) Expressions of NCOA4, FTH, FTL, PTGS2, and ATG5 in neuronal cells were evaluated by Western blot. n = 3. *p < 0.05 vs. Hemin, #P < 0.05 vs. Hemin+oe-NC, &p < 0.05 vs. Hemin+oe-YTHDC2+oe-NC.
Supplementary Figure 3.jpg
Download JPEG Image (113.2 KB)
Supplementary File 1.pdf
Download PDF (44.4 MB)Supplementary Figure 1.jpg
Download JPEG Image (223.5 KB)
Supplementary Text 1.docx
Download MS Word (16.2 KB)Supplementary Figure 2.jpg
Download JPEG Image (1.5 MB)
Data availability statement
The data used to support the findings of this study are available from the corresponding author upon request.