
Figures & data
Table 1. RICHS participant demographics.
Figure 1. Distribution of systematic 5hmC across the placental epigenome. Systematic CpGs were defined as loci with 5hmC proportion > 0.10 in at least 50% (n = 113) of samples. A total of 689,815 autosomal CpGs were assayed. Among those 46,921 (6.8%) were considered systematic, with the remaining 642,894 (93.2%) deemed non-systematic. (a) distribution of all CpGs sites (blue) and systematic sites (red) on EPIC array. 5hmC proportions display a strong right skew, with samples having a mean of 2.98% (indicated by the vertical dashed blue line). Systematic CpGs had a 5hmC mean of 15.57% across samples (indicated by vertical dashed red line). (b) distribution of systematic 5hmC by gene and CGI compartments. ORs and 95% CIs were determined by Fisher’s exact test, with ORs marked by asterisks defined as significant (p < 0.05). ORs above 1.0 indicate enrichment for systematic 5hmC in comparison to other location classifiers, and ORs below 1.0 indicate depletion. CpGs associated with > 1 gene class may be counted twice. CGI shores define loci < 2 kb from CGI, shelves are loci 2–4 kb from CGI, and open seas are loci > 4 kb from CGI.
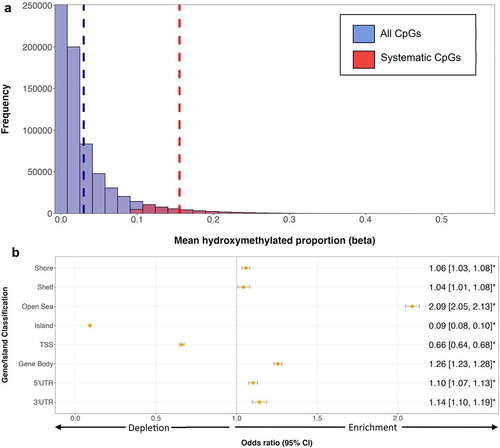
Figure 2. Placental 5hmC distribution across ChromHMM states. Box plots denote distribution of 5hmC, with boxes encompassing 25th to 75th percentile (with the length of the box representing the interquartile range (IQR), defined as the difference between the 25th and 75th percentiles), the median denoted as line within box, and the upper and lower whiskers marking the maximum and minimum values no further than 1.5 x IQR, respectively. Outliers were suppressed to improve visualization of differences. Inset plot represents the plot with outliers included. One-way repeated measures ANOVA revealed significant differences in 5hmC levels across states (p < 0.05).
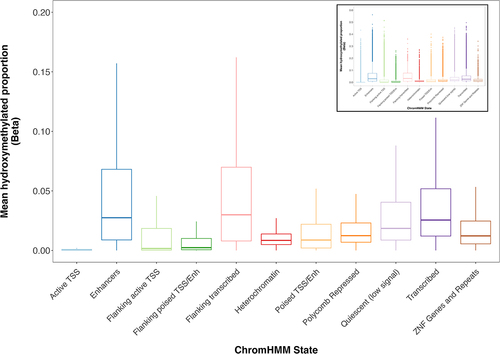
Figure 3. Placental 5hmC distribution across gene compartments of genes with varying expression levels. Genes were grouped into expression quartiles based on mean transcript levels across all subjects. CpG probes were mapped to compartment of nearest gene from EPIC array annotation package. Box plots denote distribution of 5hmC, with boxes encompassing 25th to 75th percentile (with the length of the box representing the IQR, defined as the difference between the 25th and 75th percentiles), the median denoted as line within box, and the upper and lower whiskers marking the maximum and minimum values no further than 1.5 × IQR, respectively. Outliers were suppressed to improve visualization of differences. Inset plot represents the plot with outliers included. Asterisks mark significant differences in 5hmC levels across expression quartiles within each gene compartment (ANOVA p < 0.05).
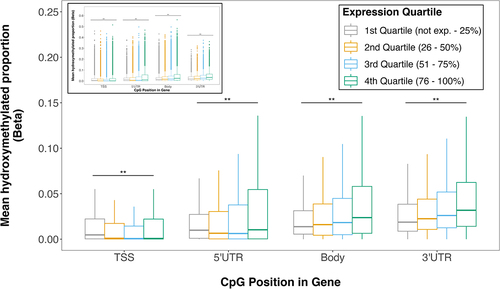
Table 2. eQTHM summary results.
Figure 4. Characterization and distribution of genomic location of eQTHM signals (below empirical-p threshold, n = 499). (a) percentage of positively and negatively correlated eQthms across gene compartments of target gene. (b) percentage of positively and negatively correlated eQthms across CGI compartments. Fisher’s exact tests were used to test for enrichment of positively and negatively correlated eQthms across gene compartments (a) and CGI regions (b). (c) CpG distance from TSS/TTS of target eQTHM gene. TSS and TTS are represented by 0, 1 on x-axis, respectively. CpGs lying within gene have distance represented by proportion through gene. Shown are significant eQthms (dashed purple line) and all cis CpG-gene pairs from matrix eQTL (solid black line). (d,e) proportion of CpGs within ChromHMM states. Shown are negatively (Neg) and positively (Pos) associated CpGs (d), along with all significant CpGs (sig) and all CpGs on EPIC array (e). Fisher’s exact tests were used to test for enrichment of eQthms across ChromHMM states. Numbers on top of each bar represent # of CpGs in that group.
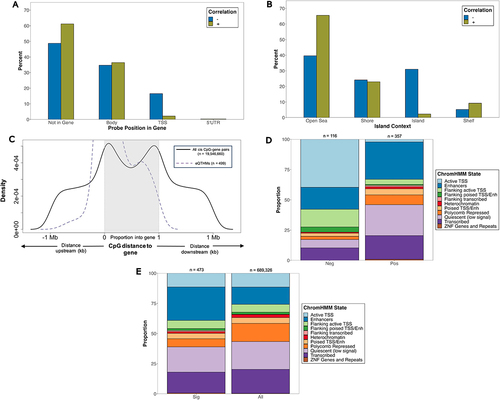
Figure 5. Characterization and distribution of transcription-associated DHMRs. Percentage of all significant DHMRs (n = 107) across (a) genic compartments and (b) CGI regions. (c) proportion of CpGs across ChromHMM states among CpGs in and out of DHMRs. Fisher’s exact tests were used to test for enrichment of CpGs across ChromHMM states. Numbers on top of each bar represent number of CpGs in that group. (d) most significant DHMR at B3GNT3 gene. Hydroxymethylated proportions among subjects at each of the 8 CpG probes (represented by vertical lines of stacked points) in the DHMR are shown. Data is stratified by B3GNT3 log2TMM expression quartiles among subjects. CpG site positions are displayed along the x-axis. Lines represent local regression model using the locally estimated scatterplot smoothing (LOESS) method.

Table S2_All_Significant_DHMRs.csv
Download Comma-Separated Values File (7.3 KB)Table S1_All_Significant_eQTHMs.csv
Download Comma-Separated Values File (43.3 KB)Figure_S1_Prisma_Workflow.docx
Download MS Word (32.5 KB)Data availability statement
Raw data were generated at Emory University. Derived data supporting the findings of this study are available through the Gene Expression Omnibus (GEO, accession number: GSE144129).