
Figures & data
Figure 1. (a) Distribution of the median methylation levels of cg07158503, cg11608150, cg06478886, cg04481923, cg18678645, cg06536614, cg25340688, cg26896946, cg00124993, cg08745965 and cg18797653, located in the DMR overlapping nc886 (GSE40279). Two clusters can be observed: individuals with a 50% methylation level (~75% of the population) and those with a methylation level close to 0% (~25% of the population). In the former, the maternal allele is methylated [Citation6–8,Citation42,Citation43] and the paternal allele unmethylated and permissive for transcription, whereas in the latter cluster, both alleles are unmethylated and permissive for transcription. (b) Schematic presentation of the nc886 gene, nc886 DMR and the CTCF-binding sites flanking the DMR. The telomeric CTCF-binding site has been suggested to interact with another binding site near the IL9 gene, bringing a suggested enhancer region close to the nc886 gene [Citation1,Citation27]. Made with BioRender.com.
![Figure 1. (a) Distribution of the median methylation levels of cg07158503, cg11608150, cg06478886, cg04481923, cg18678645, cg06536614, cg25340688, cg26896946, cg00124993, cg08745965 and cg18797653, located in the DMR overlapping nc886 (GSE40279). Two clusters can be observed: individuals with a 50% methylation level (~75% of the population) and those with a methylation level close to 0% (~25% of the population). In the former, the maternal allele is methylated [Citation6–8,Citation42,Citation43] and the paternal allele unmethylated and permissive for transcription, whereas in the latter cluster, both alleles are unmethylated and permissive for transcription. (b) Schematic presentation of the nc886 gene, nc886 DMR and the CTCF-binding sites flanking the DMR. The telomeric CTCF-binding site has been suggested to interact with another binding site near the IL9 gene, bringing a suggested enhancer region close to the nc886 gene [Citation1,Citation27]. Made with BioRender.com.](/cms/asset/110930cd-0dac-44a1-b664-b262dcfc83c4/kepi_a_2332819_f0001_oc.jpg)
Figure 2. Establishment of the nc886 methylation pattern. The methylation pattern of the non-methylated or imprinted nc886 locus is suggested to be established during the maturation of the oocyte. We further hypothesize that the intermediate methylation pattern is caused by the sporadic loss of methylation during the global de-methylation of the embryonic genome or the gain of methylation during the re-methylation. After implantation, the methylation pattern, as well as rough portions of non-methylated and imprinted cells in intermediately methylated individuals, remain unchanged in the majority of somatic tissues. Made with BioRender.com.
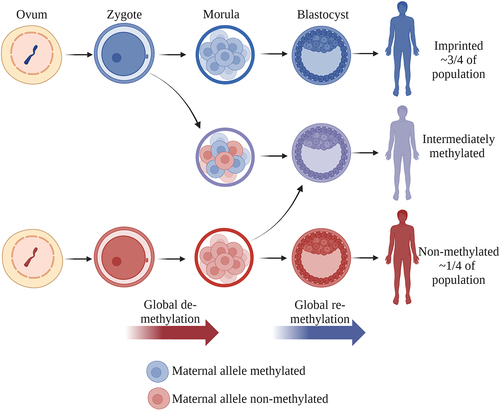
Figure 3. Percentages of imprinted (in colour) and non- and intermediately methylated individuals in the nc886 locus in population cohorts with ancestral origins in Africa (green), Europe (blue) and Asia (orange). The percentage of imprinted individuals in populations with ancestral origins in Africa is higher, and in populations originating from Asia lower, than the 75% previously reported populations of European ancestryCitation1. Populations marked with a star are from the same sample series (GSE36369), and these populations are thus free of technical or sample collection bias when compared to each other. Data processing and thresholds for imprinted individuals are presented in the supplementary materials and methods and in Supplementary Figure S2.
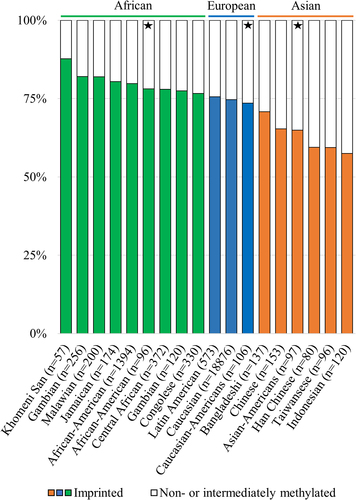
Figure 4. Reanalysing and attempting to replicate findings linking the nc886 methylation pattern to (a) the season of conception [Citation13] (GSE59592 and GSE99863), (b) Postnatal (10.5061/dryad.k67kf) and periconceptional (GSE116379) exposure to famineCitation14, and (c) Parkinson’s disease (GSE165081, GSE145361 and GSE111629). (a) The original discovery by Silver et al. (GSE59592Citation13) associating lower levels of nc886 methylation to the season of conception remains statistically significant even after clustering individuals into imprinted and non-methylated or intermediately methylated (p = 0.049), but this finding is not replicated in the other Gambian population cohort available. The significant association between postnatal exposure to famine (b) and Parkinson’s disease (c) disappears when the nc886 methylation pattern is treated as a categorical variable and is not replicated in datasets with similar or related study settings. Data processing and thresholds for imprinted individuals are presented in supplementary materials and methods and in Supplementary Figure S2.
![Figure 4. Reanalysing and attempting to replicate findings linking the nc886 methylation pattern to (a) the season of conception [Citation13] (GSE59592 and GSE99863), (b) Postnatal (10.5061/dryad.k67kf) and periconceptional (GSE116379) exposure to famineCitation14, and (c) Parkinson’s disease (GSE165081, GSE145361 and GSE111629). (a) The original discovery by Silver et al. (GSE59592Citation13) associating lower levels of nc886 methylation to the season of conception remains statistically significant even after clustering individuals into imprinted and non-methylated or intermediately methylated (p = 0.049), but this finding is not replicated in the other Gambian population cohort available. The significant association between postnatal exposure to famine (b) and Parkinson’s disease (c) disappears when the nc886 methylation pattern is treated as a categorical variable and is not replicated in datasets with similar or related study settings. Data processing and thresholds for imprinted individuals are presented in supplementary materials and methods and in Supplementary Figure S2.](/cms/asset/f67d4bb7-b9a6-4109-9d12-370bf3cf52da/kepi_a_2332819_f0004_oc.jpg)
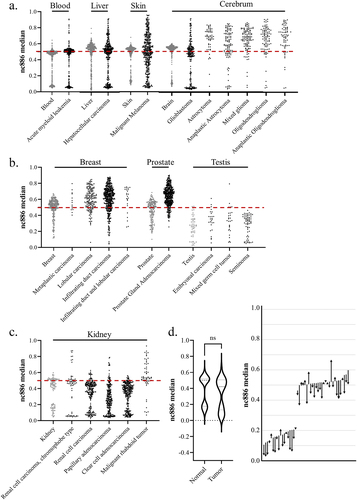
Figure 5. (a – c) The median methylation level of nc886 in tumour samples (in black) from the cancer genome atlas program (TCGA) and from corresponding healthy tissues (in grey). (a) In some cancer types, the original bimodal methylation pattern is faithfully or near-faithfully maintained (acute myeloid leukaemia and hepatocellular carcinoma), while in others, the pattern is completely lost (malignant melanoma). In tumours from the cerebrum (excluding glioblastoma), a systematic hypermethylation can be observed. (b) the bimodal methylation pattern of nc886 is already missing in the healthy breast, prostate and testis samples, with breast and prostate cancer demonstrating hypermethylation, whereas the pattern in testicular tumours corresponds to the hypomethylated unimodal pattern also observed in the healthy tissue. (c) interestingly, renal carcinomas are observed to present hypomethylation in comparison to healthy tissue, while some malignant rhabdoid tumours of the kidneys are hypermethylated. (d) when analysing median nc886 methylation from the healthy adjacent tissue and the tumour in clear cell adenocarcinoma (GSE61441)Citation135, a non-significant minor hypomethylation can be observed in the tumours, but an analysis of changes at the individual level reveals a more systematic hypomethylation pattern. The start of the arrow represents the methylation level of the healthy tissue and the end of the arrow the methylation level of the tumour, with each arrow representing one individual. Data processing and thresholds for imprinted individuals are presented in supplementary materials and methods and in Supplementary Figure S5.
Odd duck_supplementary file.pdf
Download PDF (1.1 MB)Data availability statement
All new analyses performed have utilized data that are freely available or available upon reasonable request. For different geographic origins, data from Khomeni San (GSE99029 [Citation64], Gambian (GSE99863 [Citation118], Malawian and Jamaican (GSE112893 [Citation119], African American (GSE210255 [Citation120], Multiethnic American (GSE36369 [Citation65], Central African (https://ega-archive.org/EGAD00010000692; [Citation66], Gambian (GSE59592 [Citation13], Congolese (GSE224363 [Citation121], Latin American (GSE77716 [Citation122], individuals of European ancestry (summary statistics [Citation6], Bangladeshi (http://datadryad.org/10.5061/dryad.k67kf [Citation14], Chinese (GSE116379 [Citation78] Han Chinese (GSE201287 [Citation123], Taiwanese (GSE78904 [Citation124] and Indonesian (https://figshare.com,10.26188/5e00abd72f581, [Citation67] cohorts were utilized. In the reanalyses and attempts to replicate previous associations of nc886 methylation pattern and phenotypes, the following datasets were used: GSE52576 [Citation57] for parthenogenetically activated oocytes and embryonic stem cells; GSE59592 and GSE99863 for season of conception; http://datadryad.org/10.5061/dryad.k67kf, and GSE116379 for postnatal and prenatal exposure to famine; and GSE165081 [Citation81], GSE145361 [Citation83] and GSE111629 [Citation125] for the presence of Parkinson’s disease. Methylation data from tumours was downloaded from The Cancer Genome Atlas Program (TCGA), and the healthy reference tissues data were utilized as follows: brain (GSE72778 [Citation126], blood (GSE40279 [Citation127], liver (GSE61258 [Citation128] and GSE180474 [Citation129], skin (GSE90124 [Citation130], prostate (GSE76938 [Citation131] and GSE213478 [Citation132], breast (GSE88883 [Citation133], GSE101961 [Citation134] and GSE213478 [Citation132], testis (GSE213478 [Citation132] and kidney (GSE61441 [Citation135] and GSE213478 [Citation132].