Figures & data
Figure 1. Summary of the overall study design. Main analysis (EWAS) in solid-line box, showing discovery and replication studies. Additional analyses performed on the replicated CpG sites described in dashed-line boxes.
Table 1. Characteristics of the discovery (n = 10,329) and replication (n = 3,104) study populations.
Figure 2. CpG sites significantly associated with CRP; (a) Manhattan and (b) volcano plots of 1,150 significant CpG sites in the discovery set (CRP discovery), and 113 replicated CpG sites (CRP replicated) with a red circle around the five novel CpG sites; (c) volcano plots of replicated CpG sites with post hoc meta-analysis performed separately by race and ethnic groups to demonstrate the consistent direction of effect [NS = not significant].
![Figure 2. CpG sites significantly associated with CRP; (a) Manhattan and (b) volcano plots of 1,150 significant CpG sites in the discovery set (CRP discovery), and 113 replicated CpG sites (CRP replicated) with a red circle around the five novel CpG sites; (c) volcano plots of replicated CpG sites with post hoc meta-analysis performed separately by race and ethnic groups to demonstrate the consistent direction of effect [NS = not significant].](/cms/asset/83d94269-811f-4cb0-b70c-62f941b33b51/kepi_a_2333668_f0002_oc.jpg)
Table 2. CpG-gene transcript pairs; cis-eQTM analysis results (1 × 10⁻⁷) for CpG sites significantly associated with CRP; see table S5 for full list of eQTM results.
Table 3. GO biological pathways enriched in genes corresponding to the 113 replicated CpG sites associated with CRP levels, all FDR < 0.05 (see table S6 for full list).
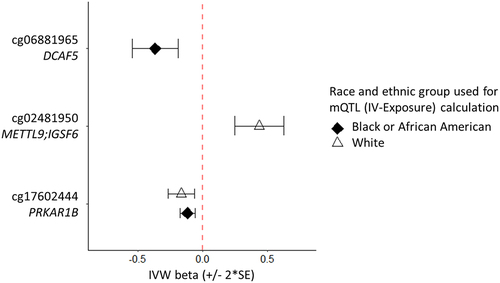
Figure 3. CpG sites inferring DNA methylation as causal to a change in CRP level.