
Figures & data
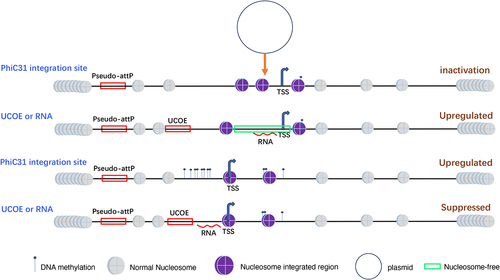
Figure 1. Expression and stability of the EGFP gene in cell clones integrated with PhiC31 and non-PhiC31 integration vectors, analysed using fluorescence intensity, flow cytometry, and qRT-PCR. (a) Fluorescence microscopy images of four cell clones. (b) Flow cytometry analysis results of the four vector cell clones. (c) qRT-PCR analysis of the EGFP gene expression levels for the four vectors. (d) Analysis of fluorescence intensity to assess stable EGFP expression for the four vectors.
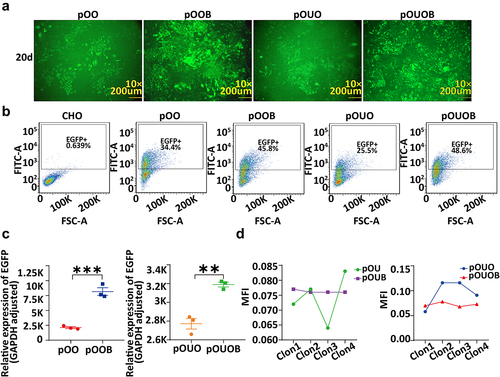
Figure 2. The relationship between chromatin structure changes in the promoter regions of PhiC31-integrated vectors and their expression levels. (a) Structure of the four vectors, pO, pOB, pS, and pSB. (b) Western blot analysis of EGFP expression in the cell clones containing the four vectors.(c) qRT-PCR analysis of EGFP expression in the cell clones containing the four vectors. (d) Fluorescence microscopy images of the cell clones containing the four vectors. (e) ImageJ analysis of fluorescence intensity in the cell clones containing the four vectors. (f) Schematic representation of chromatin structure in the promoter regions of the four vectors obtained based on NOMe-seq analysis.
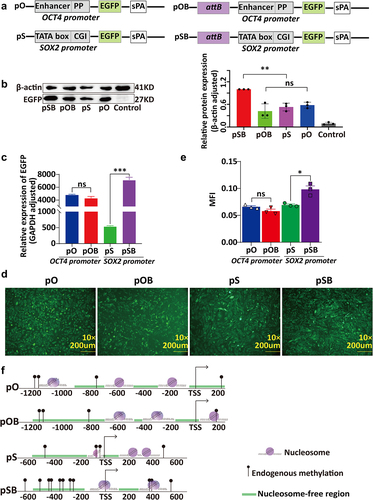
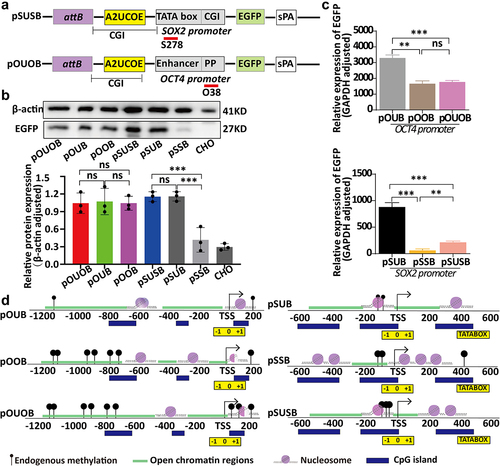
Figure 3. Relationship between ubiquitous chromatin-opening element (UCOE) regulation, chromatin structural changes, and expression levels of PhiC31 integration site sectors. (a) Structure of ubiquitous chromatin-opening element (UCOE)-regulated vectors. (b) Results of western blot and qRT-PCR analyses showing EGFP expression levels for the four vectors. (c) Changes in DNA methylation in the OCT4 and SOX2 promoter regions within the PhiC31 integration site following UCOE regulation. (d) Analysis of changes in chromatin structure in the PhiC31 integration site before and after UCOE regulation based om NOMe-seq analysis.
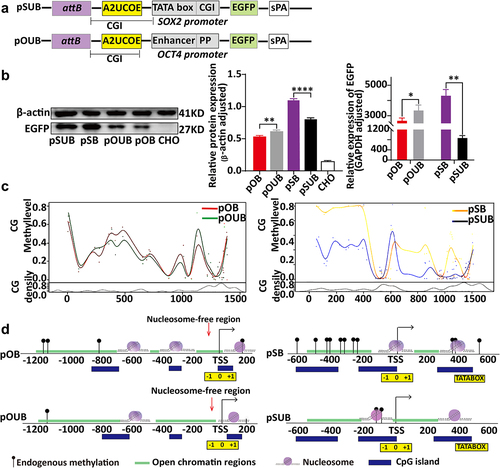
Figure 4. Analysis of relative expression levels and chromatin structure in small activating RNA (saRNA)-targeted PhiC31 integrated vectors containing OCT4 and SOX2 promoters. (a) A Schematic representation of saRNA targeting the promoters of PhiC31 integrated vectors. (b and c) Analysis of the effect of saRNA targeting on EGFP expression levels using western blotting.(d) Analysis of the average fluorescence intensity of EGFP in saRNA targeted PhiC31 integrated vectors. (e) Combined visualization of chromatin structure changes using NOMe-seq and nucleosome deletion analyses, represented by curve plots and site maps.
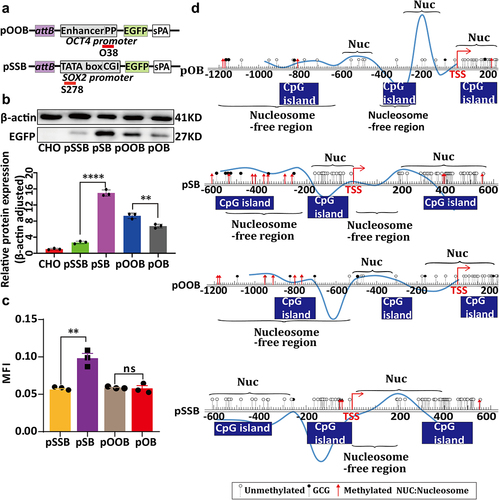
Figure 5. Changes in chromatin structure and effects on expression levels induced by simultaneous targeting of PhiC31 integration site promoters using ubiquitous chromatin-opening elements (UCOE) and small activating RNAs (saRnas). (a) Structural representation of vectors in which UCOE and saRNA co-regulate the same promoter. (b and c) Analysis of the effects of UCOE and saRNA co-regulation on EGFP expression levels using western blotting and qRT-PCR methods.(d) a schematic representation of chromatin structure changes in the vectors analysed based on NOMe-seq.
Supplementary table 1 Primers for nucleosome deletion analys.docx
Download MS Word (25.7 KB)Data availability statement
Data will be available from the authors upon request.