Figures & data
Figure 1. Differentially methylated CpG sites between healthy controls and RSM patients. (a) The purity of the isolated decidual macrophages was detected by FACS. The cells that were positive for CD45 and CD14 were considered decidual macrophages. CD45+CD14+ cells were also positive for CD68, a pan-macrophage marker. (b) Principal component analysis clearly showed separation between normal macrophages (red square, n = 3) and RSM macrophages (yellow square, n = 3). (c) Heatmap generated from clustering- analysis of microarray data illustrating differentially methylated DNA sites in the RSM patient group relative to the control group. Blue and red represent hypomethylation and hypermethylation, respectively, whereas white indicates no change in methylation relative to the control. Each row represents the beta value of a differentially methylated CpG site and each column represents one sample. (d) Pathways enriched in differentially methylated genes were determined using the GO database.
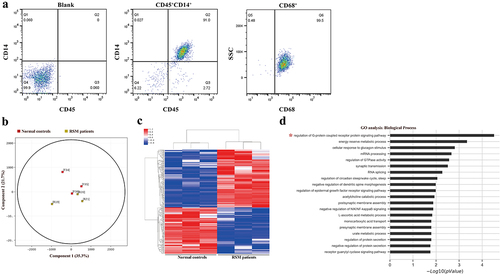
Figure 2. Differentially expressed genes between healthy controls and RSM patients. (a) Volcano plot showing that the two vertical lines are the 2-fold change boundaries and that the horizontal line is the statistically significant boundary (p < 0.05). Genes with a fold change ≥ 2 and statistical significance are marked with red and blue dots, respectively. (b) A heatmap was generated. Each line represents a single gene and each column represents a sample. Different colours indicate different expression levels. Red and black indicate upregulation and downregulation, respectively.
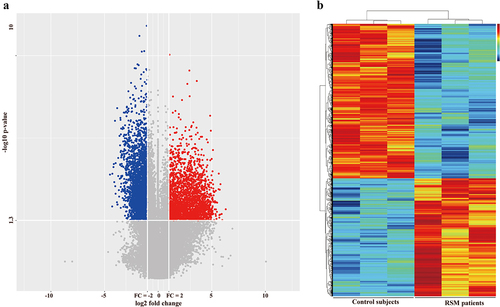
Table 1. Genes that showed significantly negatively correlations between gene expression levels and methylation levels.
Figure 3. Validation of the microarray results via qRT – PCR. the data are presented as the means ± SDs and were analysed by two-sided unpaired Student’s t tests. **p < 0.01.
Figure 4. Methylation status was evaluated by BSP in decidual macrophages. (a) The methylation status of the CpG islands in five genes (TRPC4, RHBDF1, EPAS1, SLC44A4 and GPR133) was evaluated via BSP in macrophages isolated from first-trimester human decidual tissues. (b) Methylation rates of the GPR133 gene were assessed in decidual macrophages from normal individuals and RSM patients, and the statistical data are represented as the means ± SEMs of the sequenced clones. An unpaired Student’s t test was performed for significance testing. **p < 0.05.
Figure 5. Increased expression of GPR133 was found in decidual macrophages from RSM patients. (a) The expression of GPR133 was examined in decidual macrophages from normal subjects (top row) and RSM patients (bottom row) using immunofluorescence microscopy. Scale bar = 25 μm. (b) Quantification of the fluorescence signal for GPR133 was performed using ImageJ. The mean integrated density of each field was normalized to the number of CD68-positive cells in the field. The statistical data are presented as the means ± SEMs and were analysed by two-sided unpaired Student’s t tests. **p < 0.01.
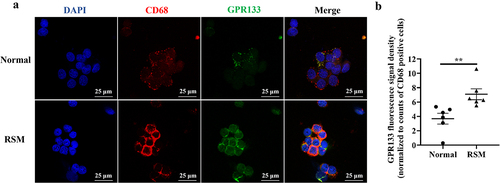
Figure 6. The percentage of apoptotic HTR-8/SVneo cells that underwent phagocytosis was estimated for first-trimester decidual macrophages from normal controls and RSM patients. (a) HTR-8/SVneo cells were seeded in 6-well culture plates with or without H2O2 for 8 h, and then, an FCM assay was performed to analyse the apoptosis rate of HTR-8/SVneo cells according to the manufacturer’s instructions for the apoptosis detection kit. (b) Decidual macrophages from healthy pregnant women and RSM patients were incubated with apoptotic HTR-8/SVneo cells stained with the CMRA probe for 120 min, and then, a FCM assay was performed to analyse the efferocytosis rate of decidual macrophages stained with CD14-FITC and CD45-APC. The efficiency of the phagocytosis was calculated as follows: (CMRA+CD45+CD14+ macrophages/CD45+CD14+ macrophages) ×100%. (c) The statistical data were analysed by two-sided paired Student’s t tests. **p < 0.01.
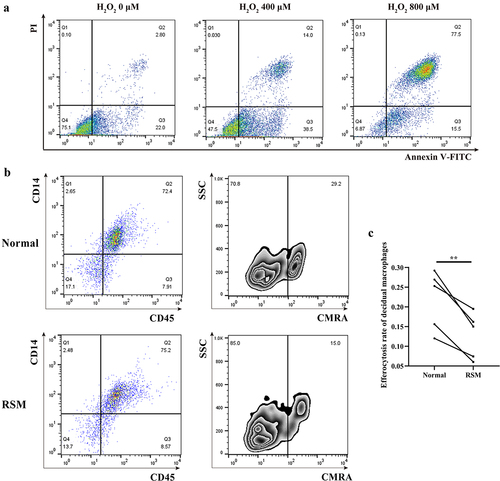
Figure 7. Upregulation of GPR133 by demethylation in decidual macrophages decreased the percentage of apoptotic HTR-8/SVneo cells that underwent phagocytosis. (a) Decidual macrophages from healthy pregnant women were treated with 5-aza-dc for 72 h; thereafter, the expression of GPR133 was measured by qRT – PCR. The data are presented as the means ± SDs and were analysed by two-sided paired Student’s t tests. **p < 0.01. (b) Decidual macrophages from healthy pregnant women were subjected to continuous demethylation treatment with 5-aza-dC for 72 h and incubated with apoptotic HTR-8/SVneo cells stained with the CMRA probe for 120 min. A FCM assay was performed to analyse the efferocytosis rate. The efficiency of the phagocytosis was calculated as follows: (CMRA+CD45+CD14+ macrophages/CD45+CD14+ macrophages) ×100%. (c) The statistical data were analysed by two-sided paired Student’s t tests. *p < 0.05.
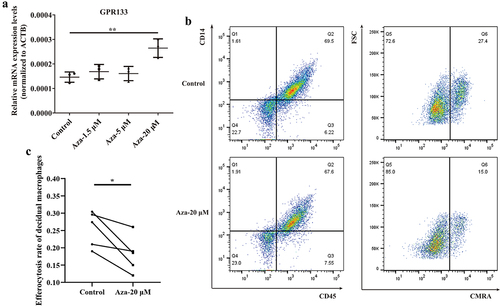
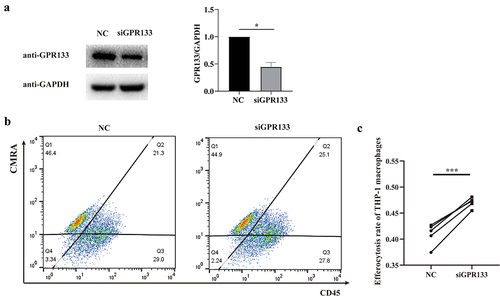
Figure 8. Knockdown of GPR133 in THP-1-derived macrophages increased the percentage of phagocytosis of apoptosis-induced HTR-8/SVneo cells. (a) THP-1 macrophages were treated with NC or GPR133 siRNA for 48 h. The expression levels of GPR133 were examined via western blotting. Densitometric quantification is shown. The statistical data were analysed by Student’s t test. The data are presented as the means ± SEMs. **p < 0.05. (b) THP-1 macrophages were treated with or without GPR133 siRNA for 48 h and then incubated with apoptotic HTR-8/SVneo cells stained with the CMRA probe for 120 min. A FCM assay was performed to analyse the efferocytosis rate in THP-1 macrophages stained with CD45. The efficiency of the phagocytosis was calculated as follows: (CMRA+CD45+ macrophages/CD45+ macrophages) ×100%. (c) The statistical data were analysed by two-sided paired Student’s t tests. *p < 0.001.