Figures & data
Figure 1. Formation of Ten-eleven translocation-nuclear bodies (TET1-NBs) and 5-hydroxymethylcytosine (5hmC) foci in CRC cells. Confocal images of (a) TET1 showing diffused distribution with few subtle nuclear structures as well as a cytoplasmic perinuclear profile in normal colon (NCM460) cells (n = 1). This intracellular distribution of TET1 concentrated in coarse nuclear bodies in HCT116 cells, (b) which is confirmed in other CRC cell lines (Caco-2, and HT-29) (n = 3). (c) For the comparative quantification and size measurement of TET1-NBs, we counted 50 cells from each cell line (NCM460, and CRC cells) (n = 3). (d) 5hmC, the demethylation mark of TET enzymes, displayed a comparable profile in NCM460 cells characterized by a randomly diffused distribution. However, 5hmC condensates into nuclear foci in (d) HCT116 cells, and in (e) Caco-2 and HT-29 cells. Nuclei are stained with DAPI (blue) with a scale bar: 5μm. (f) We counted 50 cells from NCM460 and from each CRC cell line for 5hmC foci.
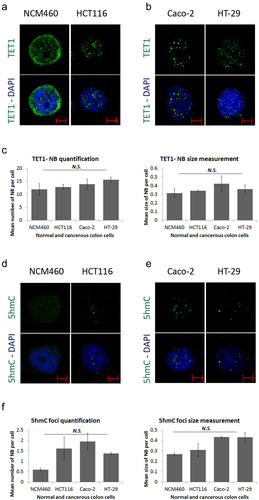
Figure 2. TET1 and promyelocytic leukemia protein (PML) are independent nuclear body proteins. (a) TET1 and PML show no co-localization as indicated by white arrowheads proteins in HCT116 cells (n = 3). To assess the ability of PML-NBs to recruit partner proteins, we co-immunostained PML-NBs with (b) SUMO1, and (c) SUMO2/3 (n = 3). The overlay of PML and SUMO isoforms is indicated by arrowheads and is confirmed by co-localization profile analysis in (d) and (e) (Scale bar: 5µm). (f) Comparative post-confocal analysis of count and size in 274 cells showing that PML-NBs are significantly fewer but larger in size with respect to the novel TET1-NBs in HCT116 cells. Error bars here represent the standard deviation of means (*p < 0.05; ***p < 0.001). (g) Pearson’s scatter plot shows no correlation between PML-and TET1-NBs in 562 cells (r = 0.6597; p = 0.5414).
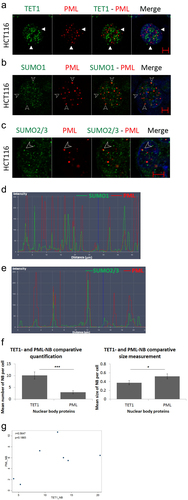
Figure 3. TET1 and its demethylation mark, 5hmC, interact with Cajal bodies. (a) Confocal images showing co-localization of TET1-NBs and CBs in HCT116 cells as indicated by arrowheads (n=3; Scale bar: 5µm). (b) Co-localization profile analysis of nuclear TET1-NBs and CBs further demonstrates the overlay of the two structures. (c) Comparative quantification and size measurement of TET1-NBs and CBs in 308 cells. (d) Comparative analysis showing significant difference between the co-localization percentage of TET1-PML and TET1-Cajal. (e) Similarly, the direct demethylation mark, 5hmC, also co-localized with CBs. (f) Post-confocal analysis in 241 cells showed that 5hmC foci were not significantly fewer than Cajal bodies while, as observed for TET1-NBs, 5hmC foci were significantly smaller than CBs. Error bars represent the standard deviation of means (***p < 0.001; ****p < 0.0001; N.S: non-significant) (g) Pearson’s scatter plot shows a positive correlation between Cajal bodies and 5hmC foci in 264 cells (r = 0.8555; p = 0.0298).
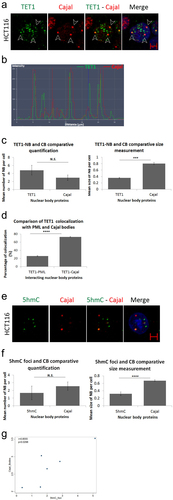
Figure 4. Vitamin C promotes nuclear body biogenesis and enhances co-localization in HCT116 cells. Comparative confocal and post-confocal analysis showing a significant increase, upon VitC treatment, in the number and size of (a) 5hmC foci in 241 cells, (b) PML-NBs in 152 cells, and (c) CBs in 241 cells (n = 3). (d) Immunofluorescence images showing the intracellular distribution pattern of 5hmC foci and Cajal bodies following 500 µM of Vitamin C (n = 3; Scale bar: 5µm). VitC treatment significantly increased the co-localization of 5hmC with PML-NBs and Cajal bodies in (e) and (f) respectively. (g) the co-localization percentage of 5hmC foci with CBs increased by 9% upon VitC treatment however, in (h) the inverse co-localization percentage showed a 3% decrease in CBs co-localization with 5hmC foci in 195 cells. Error bars here represent the standard deviation of means (*p < 0.05; **p < 0.01; ****p < 0.0001; N.S: non-significant).
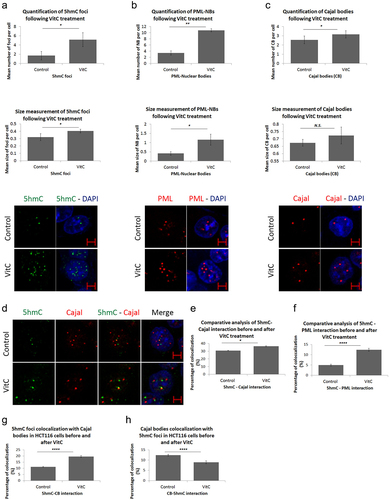
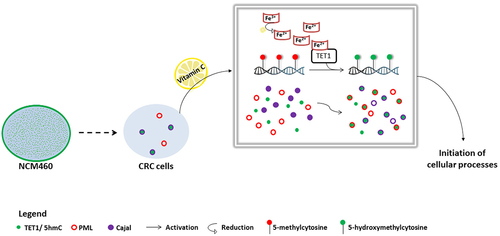
Figure 5. Proposed model of TET1 and 5hmC activation in HCT116 cells. The intracellular profile of TET1 and 5hmC shifted from a diffused distribution in colon cells (NCM460) to the formation of coarse nuclear structures in CRC cells. Our data reveal the particular association between TET1 and 5hmC nuclear condensates and Cajal bodies. VitC-mediated activation of TET1 promoted both the biogenesis of nuclear structures as well as the interaction of 5hmC with nuclear body proteins (i.e., PML and Cajal). VitC promotes the re-localization, at least in part, of 5hmC to these nuclear structures. These findings suggest the implication of TET1 in initiating several cellular mechanisms (i.e., possibly modifying RNA enriched in Cajal bodies).