Figures & data
Figure 1. The relationship between methylation at CG sites within the BRCA1 promoter and gene expression levels.
a. Schematic representation of the BRCA1 promoter region. The first exon is depicted as a blue rectangle, while the direction of transcription is indicated by an arrow. The thin blue lines denote the CpG sites, and the orange rectangles represent the CpG islands. The green rectangles denote the regions subjected to bisulphite amplicon sequencing (BSAS). b. Correlation between methylation levels at 8 CG sites within BRCA1 promoter and the expression level of BRCA1, utilizing data from The Cancer Genome Atlas (TCGA) ovarian cancer (OC) database. The x-axis displays the methylation levels of individual CG sites in the sample, and the y-axis represents the RNA-Seq by Expectation-Maximization (RSEM) value of the gene.
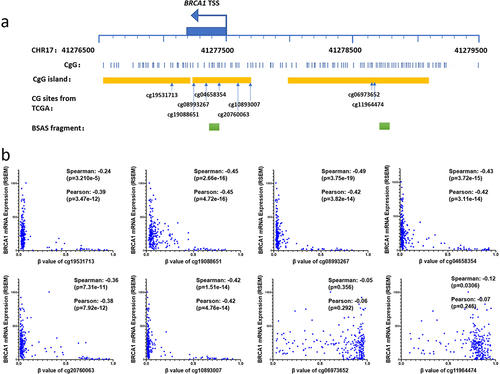
Figure 2. Methylation status of the BRCA1 promoter and its implications for OC development and homologous recombination defects (HRD).
a, b, c, &d: BRCA1 promoter methylation levels at CG sites near the transcription start site (TSS) in OC versus normal ovarian tissues (a) and in HRD-positive OC samples (HRD score ≥ 42) versus HRD-negative samples (HRD score < 42) (c); similarly, the methylation levels of CG sites upstream of the TSS in OC versus normal ovarian tissues (b) and in HRD-positive versus HRD-negative samples (d). e&f: Bar graph (e) and scatter plots (f) illustrating the relation between DNA methylation levels at the Chr17 41,277,444 site in BRCA1 promoter, BRCA1 mutations and HRD scores in OC samples. g&h: Bar graphs (g) and scatter plots (h) presenting the association between methylation levels of cg19088651, BRCA1 mutations and HRD scores in TCGA OC samples. Statistical analysis utilized a two-tailed Student’s t-test, with significance denoted as *p < 0.05, **p < 0.01, and ****p < 0.0001. i: Kaplan-Meier survival analysis assessed the impact of hypermethylation (depicted in blue) and hypomethylation (depicted in red) of cg19088651 in TCGA OC samples, with survival rates reported in days post-surgery and significance set at p < 0.05.
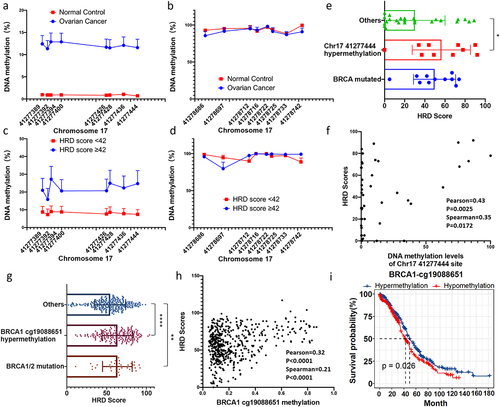
Figure 3. Design and validation of the epigenetic editor for the BRCA1 promoter.
a: Schematic diagram depicting epigenetic editing strategy applied to the BRCA1 promoter. b, c &d: DNA methylation alterations within a 400bp range around the sgRNA binding site 48 hours post-transfection in OC cells A2780 (b), OVCAR3 cells (c), and in 293T cells (d). The horizontal axis represents the chromosomal locations of the CG sites. e&f: Alterations in CG methylation levels at the BRCA1 promoter region, chromosome 17, locus 4,122,389, tracked over increasing days of cell culture in A2780 (e) and 293 cell lines (f). g: BRCA1 gene expression levels in A2780 cells post-epigenetic editing of promoter. The horizontal axis indicates the number of days in cell culture post-editing. h: Levels of H3K27Ac modification of the BRCA1 promoter post-editing. The horizontal axis represents the number of days in cell culture following epigenetic editing. Statistical analyses were conducted using a two-tailed Student’s t-test (*p < 0.05).
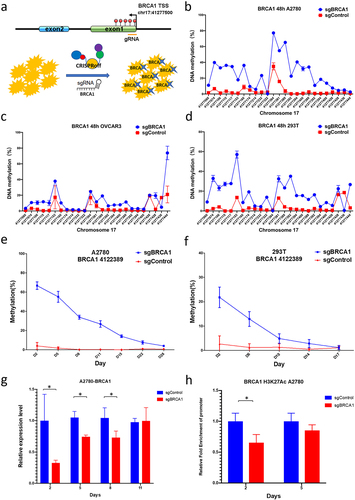
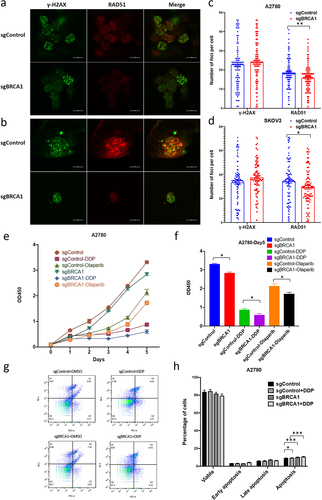
Figure 4. The impact of epigenetic editing of the BRCA1 promoter on HR repair capacity and drug sensitivity in OC cells.
a&b: Dual immunofluorescence staining of RAD51/γH2AX in A2780 (a) or SKOV3 (b) cells exposed to 1 μg/ml DDP. Scale bars are indicated as 10 μm. c&d: Quantification of γH2AX and RAD51 foci in up to 100 cells of each groups in A2780 (c) or SKOV3 (d) cells. e: The proliferation curve of A2780 cells treated with 1 μg/ml of cisplatin or 10 μM olaparib over 5 days in culture, 48 hours post-epigenetic editing, shown as OD450. f: Bar plot displaying OD450 after 5 days of drug treatment of A2780 cells, shown as means ± SEM. g&h: Apoptosis assay via flow cytometry, after staining with annexin V-FITC/propidium iodide (PI). A2780 cells were treated with 1ug/ml of cisplatin for 24 h post-BRCA1 promoter epigenetic editing. Representative scatter plots of PI (y-axis) vs. annexin V (x-axis) are depicted (g), and the percentages of viable, early apoptotic, late apoptotic, and all apoptotic cells are presented (h). Data are shown as means ± SEM of triplicate experiments (*p < 0.05, **p < 0.01).