
Figures & data
Table 1. Study sample characteristics by chemotherapy.
Figure 1. Correlation estimates between the GrimAge surrogate biomarkers of blood plasma proteins and chemotherapy.
The column represents chemotherapy and the rows represent the DNA methylation-based biomarkers of GrimAge with the Pearson correlation coefficients reported within each box.
DNAmADM, adrenomedullin; DNAmB2M, beta-2 microglobulin; DNAmCystatinC, cystatin C; DNAmGDF15, growth differentiation factor 15; DNAmLeptin, leptin; DNAmPACKYRS, smoking pack-years; DNAmPAI1, plasminogen activation inhibitor-1; DNAmTIMP1, tissue inhibitor metalloproteinase 1.
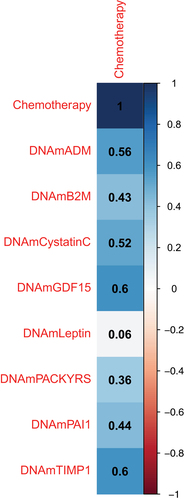
Table 2. Multiple linear regression results for the association between markers of biological ageing and chemotherapy.
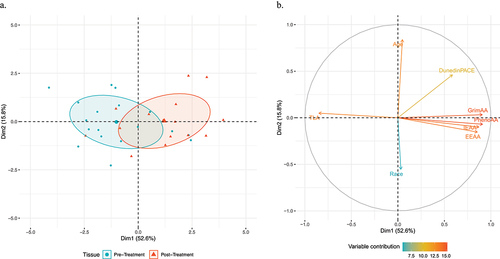
Figure 2. Principal component analysis of the association between markers of biological ageing and chemotherapy.
A. Principal component analysis plot using markers of biological ageing and covariates by chemotherapy status. B. Graphical visualization denoting the direction and contribution for each included variable in the principal component analysis in panel A. Positively and negatively correlated variables demonstrate similar or opposite directionality, respectively. Contribution to chemotherapy discrimination is colour coded from light green (low contribution) to red (high contribution).
IEAA, intrinsic epigenetic age acceleration; EEAA, extrinsic epigenetic age acceleration; PhenoAA, PhenoAge acceleration; GrimAA, GrimAge acceleration; TLA, telomere length attrition
Supplemental material
-) Supplemental Tables & figures.docx
Download MS Word (303.9 KB)Data availability statement
The dataset used in this analysis is available in NCBI’s Gene Expression Omnibus, https://www.ncbi.nlm.nih.gov/geo/query/acc.cgi?acc=GSE178887, accession number GSE178887.