
Figures & data
Figure 1. MIMOSA Workflow. MIMOSA evaluates CpG site-trait associations by: 1st) training methylome prediction models; 2nd) testing associations between predicted methylation levels and phenotype. Here, ‘cis-SNPs’ refers to single nucleotide polymorphisms within 1 Mb of a particular CpG site, and ‘LD Reference Panel’ refers to the linkage disequilibrium reference panel from the 1000 Genomes Project.
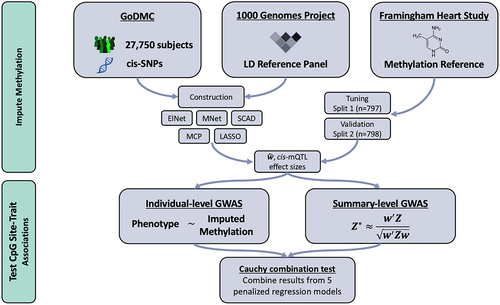
Figure 2. Comparison. A comparison of best prediction model
on test data for all CpG sites for which either MIMOSA or Baselmans hit the
threshold.
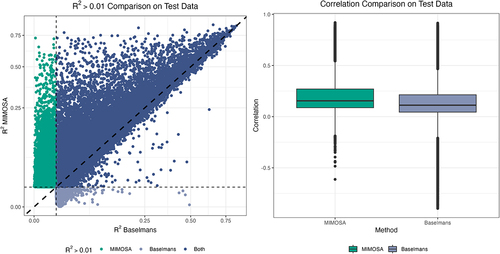
Figure 3. Evaluation of MIMOSA on real data. a) Number of significant associations between CpG sites and traits determined by MIMOSA and Baselmans for 28 GWAS using all CpG sites. b) Number of significant associations between CpG sites and traits determined by MIMOSA and Baselmans for 28 GWAS using shared CpG sites.
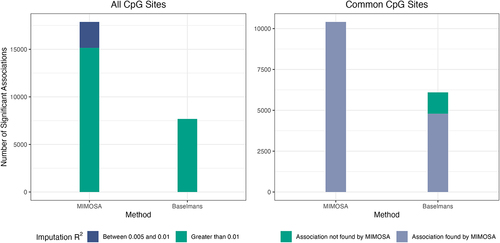
Figure 4. HCH Manhattan plot. CpG sites significantly associated with high cholesterol by MIMOSA at a Bonferroni-corrected p-value threshold .
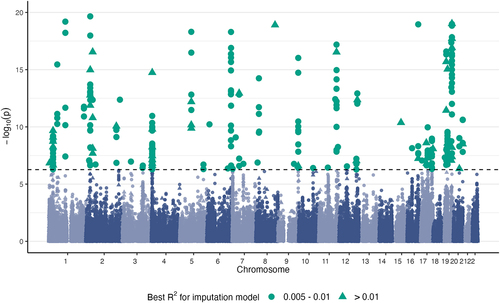
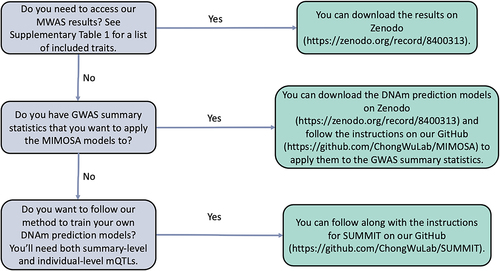
Figure 5. Flow chart for using the MIMOSA models.
MIMOSA_Supplementary_Table.xlsx
Download MS Excel (1.4 MB)Supplementary_3.pdf
Download PDF (1.2 MB)Data availability statement
The mQTL summary data are available at http://mqtldb.godmc.org.uk/downloads. The datasets of FHS Offspring Cohort are publicly available via dbGaP (www.ncbi.nlm.nih.gov/gap): dbGaP Study Accession: phs000342 and phs000724. The UK Biobank is an open-access resource but requires registration, available at https://www.ukbiobank.ac.uk/researchers/. The Baselmans models can be downloaded from http://bbmri.researchlumc.nl/atlas/#data. The 1000 Genomes Project data can be downloaded from https://www.internationalgenome.org/data. The genetic distance data for 1000 Genomes Project can be downloaded from https://github. com/joepickrell/1000-genomes-genetic-maps. The MIMOSA models are available at Zenodo https://zenodo.org/record/8400313. Real data results are available at Zenodo as well https://zenodo.org/record/8400313, where they can be easily downloaded.