
Figures & data
Figure 1. Tet1 mutants regulate common and distinct CpG sites in the adult cortex.
Note: (a) Schematic illustrating TET-mediated 5mC demethylation pathway. Tet1 HxD mutation abrogates its ability to oxidize 5mC to 5hmC, while Tet1 KO completely ablates the full-length protein. (b) of modified C in bisulphite and bACE sequencing. (c) Violin plot of the average methylation signal from all bACE (5hmC) and bisulphite (5hmC +5mC) probes in Tet1 mouse whole cortices (n = 8, Kruskal-Walis with Dunn’s multiple comparisons test, **p < 0.01, ****p < 0.0001). Each violin plot corresponds to average signals from n = 8 biological replicates. (d) SeSAMe analysis revealed locus-specific differentially 5hmC regions (DhMRs) in the Tet1 mutants (7,996 from HxDvsWT and 12,900 from KOvsWT analysed). Each DhMR corresponds to a single (a) probe on the array with FDR < 0.05. Each panel represents the number of DhMRs that have lost or gained 5hmC with corresponding 5mC status. (e) Violin plot of the mean 5hmC and 5mC levels at HxD DhMRs with 5hmC loss (top panel) and KO DhMRs with 5hmC loss (bottom panel) (n = 8, Mann-Whitney U test, ****p < 0.0001). Each violin plot corresponds to average signals from n = 8 biological replicates. (F) Venn diagram of HxD unique, common and KO unique DhMR subsets with 5hmC loss, with their respective classifications.
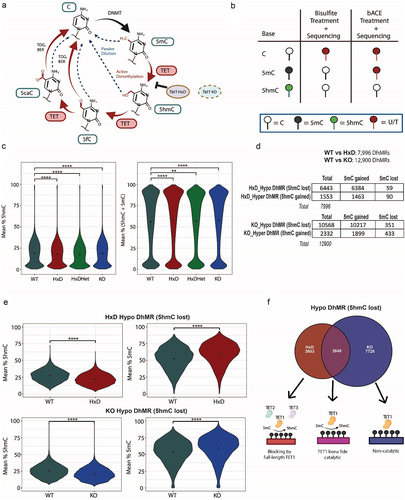
Figure 2. TET1 mainly exerts its function by modulating DhMRs in exons and introns.
Note: (a) Genomic location distributions of HxD unique, common, and KO unique Hypo DhMR subsets (with 5hmC lost). Manifest represents the annotated probe counts in Infinium mouse BeadChip array (Fisher’s exact test, **p < 0.01, ***p < 0.001, ****p < 0.0001). (b) Mean % 5hmC levels of n = 8 biological replicates within the transcription unit at common subset shared by Tet1 HxD and Tet1 KO (Mann-Whitney U test, *p < 0.05, ****p < 0.0001). HxD context denotes 5hmC changes upon catalytic mutation alone, while KO context denotes 5hmC levels upon TET1 protein ablation. (c) Mean % 5hmC levels of n = 8 biological replicates within the transcription unit at HxD unique subset (Mann-Whitney U test, **p < 0.01, ****p < 0.0001). (d) Mean % 5hmC levels of n = 8 biological replicates within the transcription unit at KO unique subset (Mann-Whitney U test, ****p < 0.0001). (e) Representative metagene profile of HxD unique DhMRs. (f) SeSAMe pipeline mining of histone modification marks enriched at DhMRs. (g) KEGG analyses of HxD unique, common, and KO unique DhMR subsets.
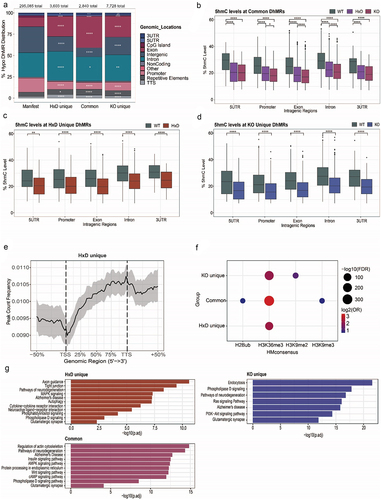
Figure 3. Tet1 perturbation is associated with decreased 5hmC.
Note: (a) Volcano plot showing differentially expressed genes (DEGs) in Tet1 HxD (vs WT) and Tet1 KO (vs WT) (FDR <0.05, Fold Change > 1.5). (b) Top panel shows overlap between all Tet1 HxD and Tet1 KO DEGs. Bottom panel shows overlap between downregulated DEGs shared by Tet1 HxD and Tet1 KO. (c) GO pathway analysis of all Tet1 KO DEGs, while Tet1 HxD analysis did not yield specific GO terms (not shown). (d) Uniprot analysis of gene products for all Tet1 HxD DEGs (top panel) and Tet1 KO DEGs (bottom panel). (e) Top panel shows the overlap between Tet1 HxD’s DEGs and corresponding DhMR-associated genes. Bottom panel shows the overlap between Tet1 KO’s DEGs and corresponding DhMR-associated genes. Nearby genes associated with DhMRs were annotated using HOMER. (Exact binomial test, ****p < 0.0001). (f) Scatterplot of 5hmC magnitude of all probes with their corresponding gene expressions in Tet1 HxD (top panel) and Tet1 KO (bottom panel).
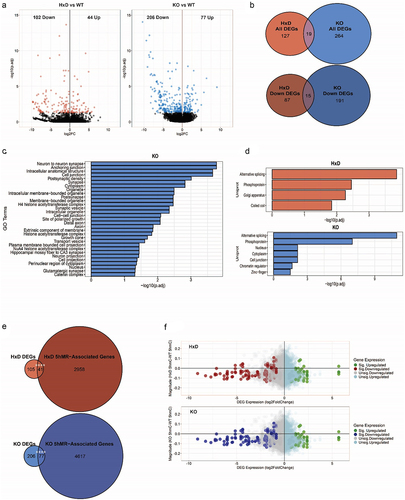
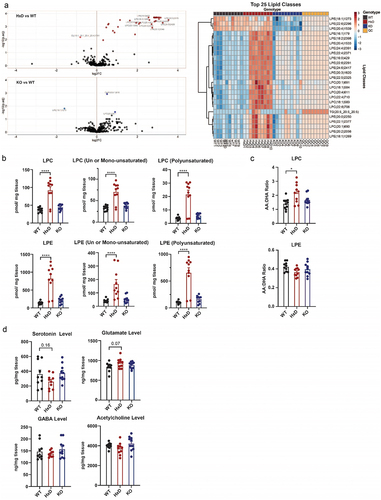
Figure 4. Tet1 HxD accumulates phospholipid LPC/LPE in the cortex while neurotransmitter levels remain intact.
(A) Left panel is volcano plot showing significantly upregulated and downregulated LPE and LPC species in Tet1 HxD (top) and Tet1 KO (bottom) (n = 10, FDR < 0.05, fold change >1.5). Right panel is heatmap (B) showing Top 25 lipid classes that are most enriched in Tet1 WT (black), Tet1 HxD (red) and Tet1 KO’s (blue) whole cortices. Quality check (QC, yellow) represents quality control pooled from all samples. (C) Bar graph shows mean levels of all LPCs and LPEs and parsed by fatty acid chains (mean ± SEM; n = 10, one-way ANOVA with Dunnett’s multiple comparisons test, ****p < 0.0001). (D) Arachidonic acid (AA) [20:4] to Docosahexaenoic acid (DHA) [22:6] ratio of LPC and LPE fatty acid side chains (mean ± SEM; n = 10, one-way ANOVA with Dunnett’s multiple comparisons test, *p < 0.05). (E) Bar graphs show mean neurotransmitter levels in Tet1 WT, Tet1 HxD and Tet1 KO whole cortices (mean ± SEM; n = 10, one-way ANOVA with Dunnett’s multiple comparisons test).
Supplemental material
Supplemental Material
Download MS Word (23.9 KB)Supplemental Material
Download MS Word (2.7 MB)TableS7_Revision.xlsx
Download MS Excel (11.7 KB)TableS6_Revision.xlsx
Download MS Excel (2.2 MB)TableS8_Revision.xlsx
Download MS Excel (42.1 KB)TableS4_Revision.xlsx
Download MS Excel (10.7 KB)TableS9_Revision.xlsx
Download MS Excel (11.1 KB)TableS1_Revision.xlsx
Download MS Excel (9 KB)TableS2_Revision.xlsx
Download MS Excel (9 KB)TableS5_Revision.xlsx
Download MS Excel (9.1 KB)TableS3_Revision.xlsx
Download MS Excel (9.6 KB)Data Availability Statement
Sequencing data have been deposited in GEO database under the accession number GSE271375 and GSE271376.