
Figures & data
Figure 1. The design and workflow chart for identifying, selecting and validating the methylated cfDNA maker panel for gastric cancer.
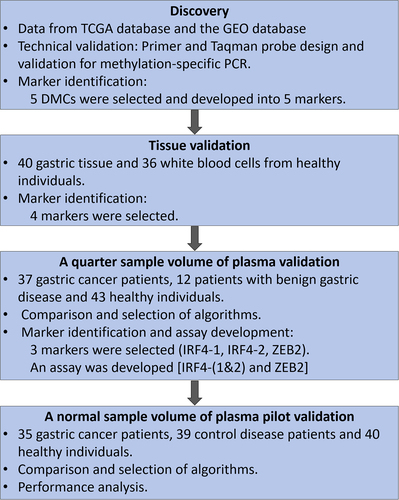
Table 1. Patient and tumour characteristics of gastric adenocarcinoma in plasma validation.
Figure 2. DNA methylation levels (β values) of the five DMCs in healthy WBC, normal gastric tissues from GEO datasets and gastric cancer tissues from TCGA dataset of STAD. The abscissa is the type of sample, and the ordinate is the methylation level (β value). The extremes of the boxes define the upper and lower quartiles, and the centre lines define the median. Statistical analysis between the two groups was performed using Wilcoxon rank sum test, with p < 0.05 indicating significance.
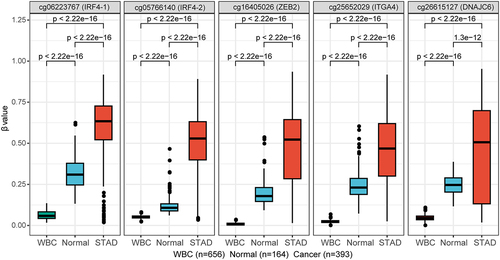
Figure 3. The methylation levels of five markers were analysed in the white blood cells of healthy individuals and gastric cancer tissues using 2−ΔΔCt values or ct values. The sample size for WBC was n = 36, and for GC it was n = 40. The upper picture displays the methylation levels based on 2−ΔΔCt values, while the lower picture shows the methylation levels based on ct values. Statistical analysis between the two groups was performed using Mann-Whitney test, with p < 0.05 indicating significance.
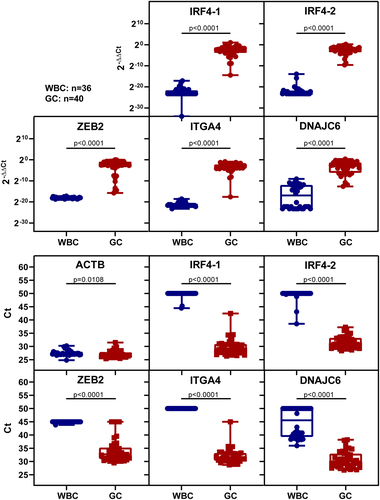
Table 2. The detection rates of markers in healthy white blood cells and gastric cancer tissues.
Figure 4. The methylation levels of selected markers in a quarter sample volume of plasma were analysed using 2−ΔΔCt values or Ct values. The study included healthy individuals, those with benign gastric disease, and those with GC. The upper picture displays the methylation levels based on 2−ΔΔCt values, while the lower picture shows the methylation levels based on Ct values. Statistical analysis between two groups was performed using Mann Whitney-test, and p < 0.05 was considered significant.
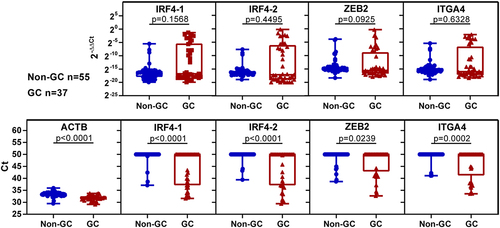
Table 3. The diagnostic performance of markers was evaluated using a quarter sample volume of plasma samples analysed based on 2−∆∆Ct values or Ct values.
Figure 5. The methylation levels of selected markers in plasma samples and ROC curves. (a) displays the methylation levels based on 2−ΔΔCt values, while (b) displays the methylation levels based on ct values. CD represents control disease and GC represents gastric cancer. Statistical analysis between two groups was performed using Mann-Whitney test, and p < 0.05 was considered significant. (c) are ROC curves of single marker and marker combination based on 2−ΔΔCt values (left) and ct values (right). Combination represents IRF4-(1&2) and ZEB2.
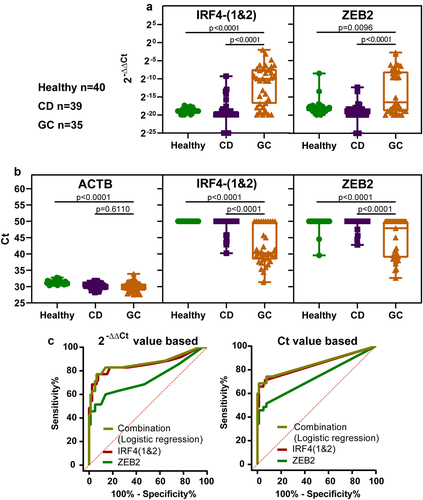
Table 4. The diagnostic performance of markers in plasma validation analysed based on 2−∆∆Ct or ct values.
Supplementary tables.xlsx
Download MS Excel (14.9 KB)Supplementary figures_revised.docx
Download MS Word (462.2 KB)Data availability statement
The datasets used and/or analysed during the current study are available from the corresponding author upon reasonable request.