
Figures & data
Figure 1. (a) Gene expression level of three DNMTs of SMSCs grown in growth medium (Con) and osteogenic medium (Ost) over 21 days. (b) Gene expression level of three DNMTs of SMSCs derived from as and DL pigs. (c) Genic annotation of CpG sites. (d) Genomic annotation of CpG sites to DNA-methylation environments. (e) Principal component analysis (PCA) of methylation data of CpG sites. (f) Venn diagram showing unique and overlapping DMR-associated genes between control SMSCs and osteogenic induced SMSCs at each time point. (g) Venn diagram showing unique and overlapping DMR-associated genes between as and DL prior to and after osteogenic differentiation at each time point.
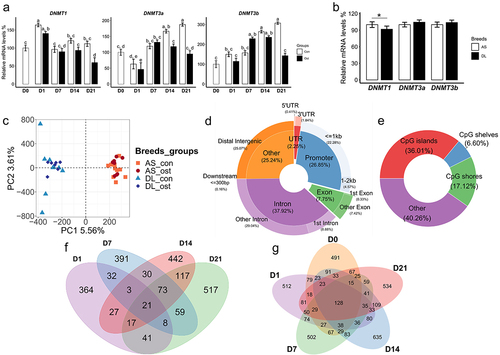
Figure 2. (a) Volcano plots of DMRs between control SMSCs and osteogenic induced SMSCs at each time point. (b) Volcano plots of DMRs between AS and DL prior to and after osteogenic differentiation at each time point.
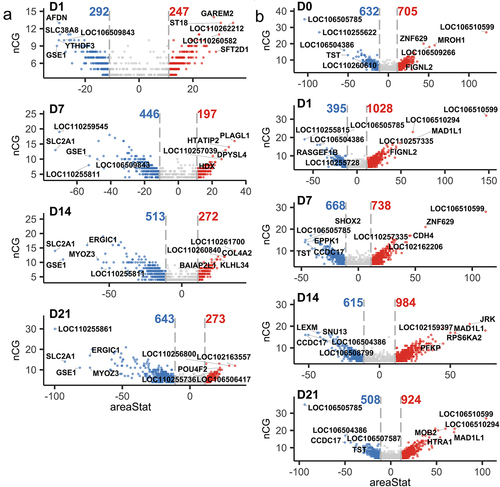
Figure 3. (a) Methylation heatmap of 209 DMRs with relative methylation difference ≥ 30% in the promoter or gene body regions between control SMSCs and osteogenic induced SMSCs at each time point. (b) Methylation heatmap of 143 DMRs with relative methylation difference ≥ 30% in the promoter region between AS and DL prior to and after osteogenic differentiation at each time point.
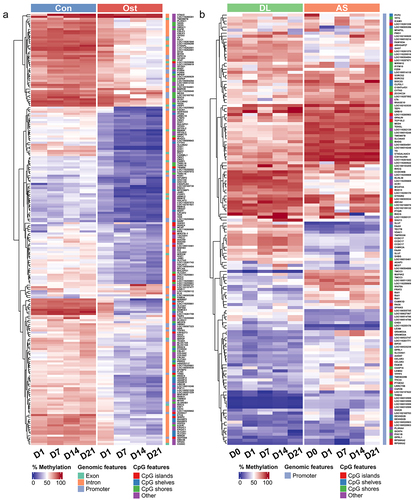
Figure 4. (a) BP and KEGG pathway enrichment analysis of DMRs-associated genes between control SMSCs and osteogenic induced SMSCs at each time point. (b) BP and KEGG pathway enrichment analysis of DMRs-associated genes between AS and DL prior to and after osteogenic differentiation at each time point. (c) IPA canonical pathway analysis of DMRs-associated genes from 9 significant time-series profiles detected by STEM.
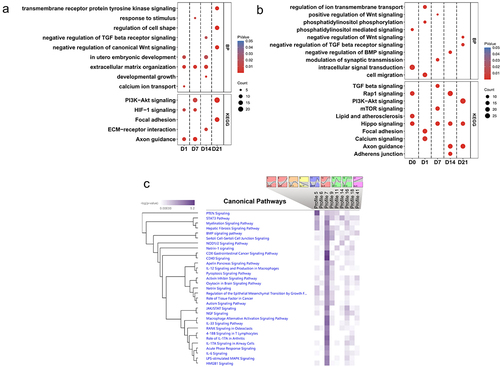
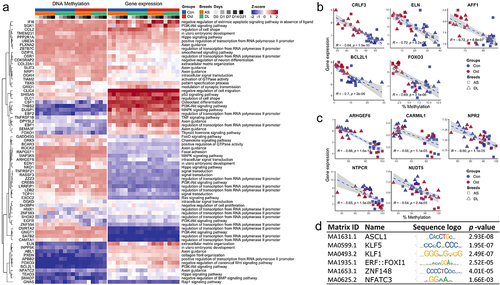
Figure 5. (a) Genes shown negative correlation between DNA methylation and gene expression and its enriched pathways. (b) Top 5 negative correlations between methylation levels and gene expression in the comparisons of control SMSCs and osteogenic induced SMSCs. (c) Top 5 negative correlations between methylation levels and gene expression in the comparisons of SMSCs from as and DL. (d) Most frequently enriched TF binding motifs in promoter DMRs.
Subplementary Table_revised.xlsx
Download MS Excel (1.6 MB)Data availability statement
All RRBS sequencing data have been deposited in the ArrayExpress database at EMBL-EBI (www.ebi.ac.uk/arrayexpress) under the accession number E-MTAB-9913.