Figures & data
Table 1. Primer sequences for RT-qPCR.
Figure 1. miR-143 reduces injury and pyroptosis in DOX-treated cardiomyocytes. a: dual-luciferase assay to analyse the targeting relationship between miR-143 and TLR2; b: RT-qPCR to detect the levels of miR-143 and TLR2; c: CCK-8 assay to detect cell viability; d: the LDH release kit to detect LDH release; e: ATP production; f: ELISA to detect IL-18 levels in cell supernatant; g: ELISA to detect IL-1β levels in cell supernatant; h: ELISA to detect TNF-α levels in cell supernatant; i-j: Western blotting to detect protein levels of TLR2 and pyroptosis-related molecules. In panels b-h and j, *p < 0.05 compared with the vehicle + mimic NC group, #P < 0.05 compared with the DOX + mimic NC group. Measurement data were expressed as mean ± standard deviation. The independent sample t-test was used for comparisons between two groups, and one-way ANOVA with Tukey’s post hoc test was used for comparisons among multiple groups. The experiments were repeated three times.
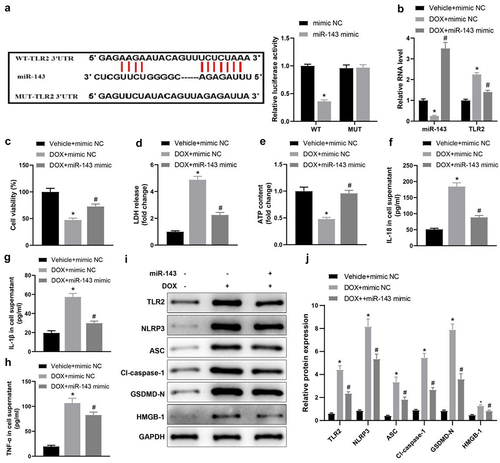
Figure 2. miR-143 improves myocardial injury in DOX-induced (2.5 mg/kg) rats (n = 5). a-d: quantitative analysis of echocardiographic detection of cardiac function (LVEF, LVFS, LVEDD, and LVESD); e-f: TUNEL staining to detect apoptosis in myocardial tissues; g-i: ELISA to detect levels of CK-MB, cTnT, and LDH in myocardial tissues; j-k: Masson staining to observe myocardial tissue fibrosis, scale bar = 50 μm; *p < 0.05 compared with the vehicle + agomir NC group, #P < 0.05 compared with the DOX + agomir NC group. Values in the figure were measurement data and expressed as mean ± standard deviation. One-way ANOVA with Tukey’s post hoc test (a-d, f-i, k) was used for comparisons among multiple groups.
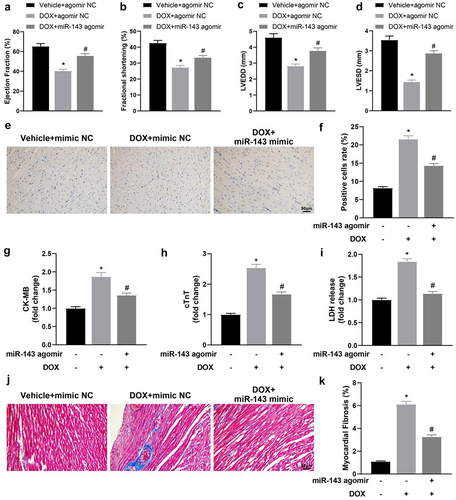
Figure 3. miR-143 prevents DOX-induced cardiomyocyte pyroptosis in vivo. a-g: Western blotting to detect levels of TLR2 protein and pyroptosis-related proteins (ASC, cleave-caspase-1, GSDMD-N, NLRP3, and HMGB1) in cardiac tissues; h-j: ELISA to detect IL-1β, IL-18, and TNF-α in rat serum; k: RT-qPCR to detect miR-143 expression in myocardial tissues; *p < 0.05 compared with the vehicle + agomir NC group, #P < 0.05 compared with the DOX + agomir NC group. Values in the figure were measurement data and expressed as mean ± standard deviation. One-way ANOVA and Tukey’s post hoc test were used for comparison among multiple groups (b-k).
Figure 4. Circ -0,006,332 overexpression accelerates DOX-induced cardiomyocyte pyroptosis through miR-143 downregulation. a: RT-qPCR to detect miR-143 and circ -0,006,332 expression in rat heart tissues; b: the FISH assay to detect intracellular co-localization of circ -0,006,332 and miR-143 in cardiomyocytes; c: dual-luciferase assay to detect the binding relationship between miR-143 and circ -0,006,332 in H9C2 cells; d: circ 0006332 and miR-143 expression measured by RT-qPCR. e: RNA pull-down assay to detect the binding of miR-143 to circ -0,006,332; f: CCK-8 assay to detect cardiomyocyte viability; g: LDH release in cardiomyocyte supernatants; h: intracellular ATP contents; i-k: ELISA to detect IL-1β, IL-18, and TNF-α levels in cell supernatants; l-m: protein levels of TLR2 and pyroptosis-related molecules (ASC, cleave-caspase-1, GSDMD-N, NLRP3, and HMGB1) in cardiomyocytes detected by western blotting. In panel A, *p < 0.05 compared with the vehicle group; in panel C, *p < 0.05 compared with the WT + mimic NC group; in panel D, *p < 0.05 compared with the IgG group; in panels F-M, *p < 0.05 compared with the vehicle + mimic NC + oe-NC group, #P < 0.05 compared with the DOX + mimic NC + oe-NC group, and $ p < 0.05 compared with the DOX+ miR-143 mimic + oe-NC group. Values in the figures were measurement data and expressed as mean ± standard deviation. Two-group comparisons were analysed with the independent sample t-test (A, D, E), and one-way ANOVA with Tukey’s post hoc test (C-F-K, M) was used for comparisons among multiple groups. The cell experiments were repeated three times.
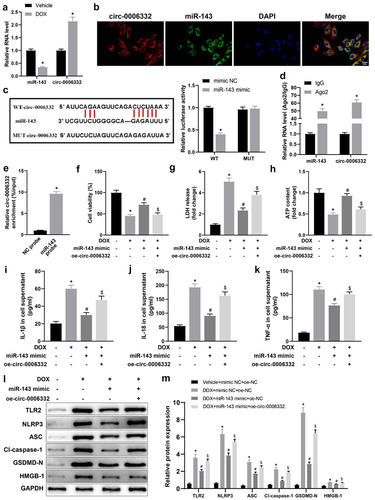
Figure 5. Overexpression of circ -0,006,332 reverses the improvement effect of miR-143 on DIC in rats. a-dd quantitative analysis of echocardiographic detection of cardiac function (LVEF, LVFS, LVEDD, and LVESD); e-f: TUNEL staining to detect apoptosis in myocardial tissues; g-i: ELISA to detect levels of CK-MB, cTnT, and LDH in myocardial tissues; j-k: Masson staining to observe myocardial tissue fibrosis, scale bar = 50 μm; *p < 0.05 compared with the vehicle + agomir NC + oe-NC group, #P < 0.05 compared with the DOX + agomir NC + oe-NC group, $P < 0.05 compared with the DOX + miR-143 agomir + oe-NC. Values in the figure were measurement data and expressed as mean ± standard deviation. One-way ANOVA with Tukey’s post hoc test (a-d, f-i, k) was used for comparisons among multiple groups.
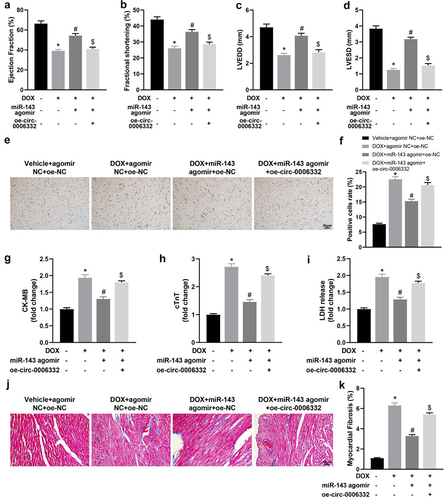
Figure 6. Overexpression of circ -0,006,332 nullifies the inhibition of miR-143 on DOX-induced cardiomyocyte pyroptosis in rats. a-b: Western blotting to detect levels of TLR2 protein and pyroptosis-related proteins (ASC, cleave-caspase-1, GSDMD-N, NLRP3, and HMGB1) in cardiac tissues; c-e: ELISA to detect IL-1β, IL-18, and TNF-α in rat serum; *p < 0.05 compared with the vehicle + agomir NC + oe-NC group, #P < 0.05 compared with the DOX + agomir NC + oe-NC group, $P < 0.05 compared with the DOX + miR-143 agomir + oe-NC group. Values in the figure were measurement data and expressed as mean ± standard deviation. One-way ANOVA and Tukey’s post hoc test were used for comparison among multiple groups (b-e).
Figure 7. The schematic diagram in the rat experimental protocol.