
Figures & data
Figure 1. Ggnbp2 controls both chromatin compaction and nucleosome stability.
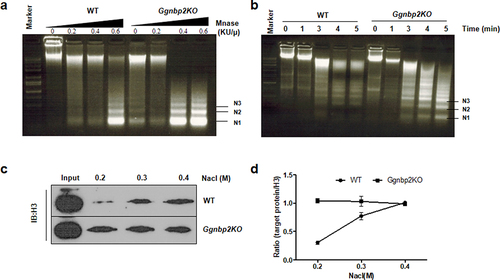
Figure 2. Ggnbp2 deletion leads to the up-regulation of H2AK119ubi and the down-regulation of H2BK120ubi.
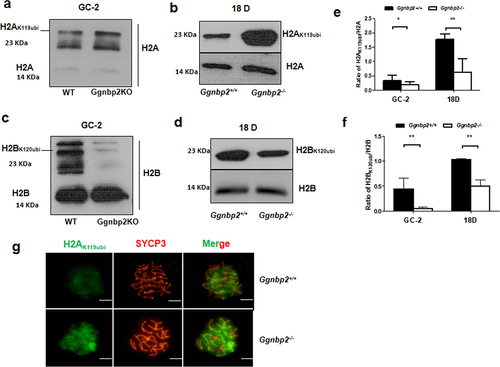
Figure 3. GGNBP2 interacts and colocalizes with ASXL1. The absence of GGNBP2 affects ASXL1 and BAP1 interaction as well as BAP1 translocation.
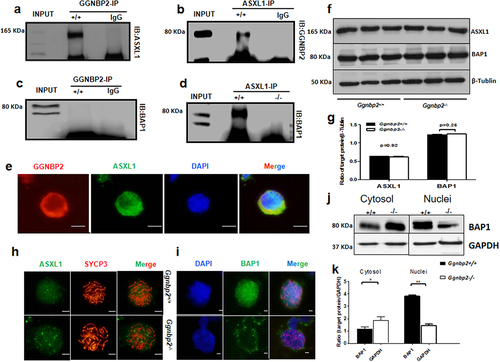
Figure 4. GGNBP2 interacts and colocalizes with UBE2B, and GGNBP2 loss affects UBE2B and RNF40 interaction.
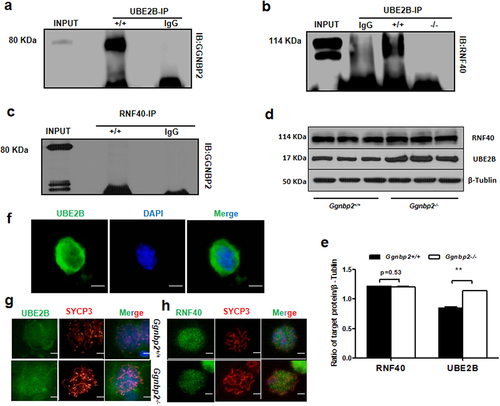
Figure 5. GGNBP2 regulates histone H2A and H2B ubiquitination levels in vitro.
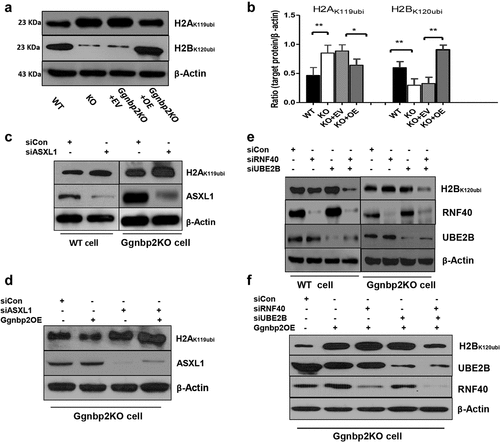
Figure 6. GGNBP2 controlled patterns of histone modification.
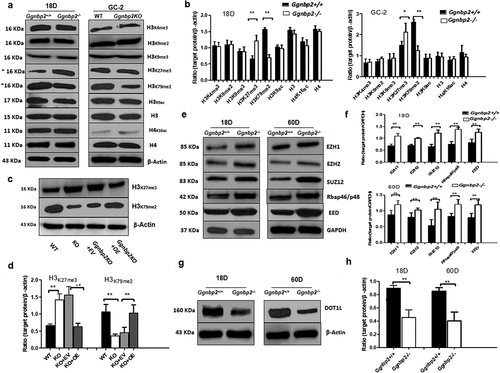
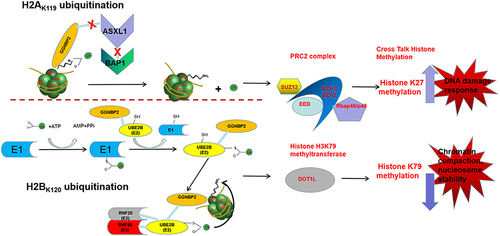
Figure 7. The mechanism of histone modifications regulated by GGNBP2.
-) Clean Table S1.docx
Download MS Word (19.6 KB)supplement figure 1.tif
Download TIFF Image (2 MB)Data availability statement
The datasets used and/or analysed during the current study are available from the corresponding author on reasonable request.