Figures & data
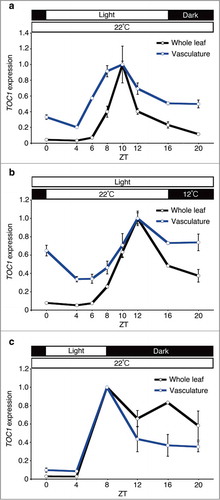
Figure 1. TOC1 expression in the whole leaf and the vasculature under long-day light-dark cycles, temperature cycles and short-day light-dark cycles. Plants were grown under long-day light-dark cycles (16 hour light / 8 hour dark at 22°C) (A), temperature cycles (16 hour 22°C / 8 hour 12°C in continuous light) (B) and short-day light-dark cycles (8 hour light / 16 hour dark at 22°C) (C) for 10 days. ZT, zeitgeber time. Mean ± s.e.m. (long day, temperature cycles, n=3; and short day, n=2). Geometric mean of IPP2 and APA1 were used as internal controls.1