
Figures & data
Figure 1. ID in NAC transcription factors. (A) Schematic domain structure of a typical NAC transcription factor. The N-terminal DNA-binding NAC domain (green) forms a twisted β sheet (Protein Data Bank accession 1UT7) followed by a disordered C-terminus (different conformers in gray) encompassing transcription regulatory activity and a large interaction potential.Citation10 (B) Predicted disorder plotted as a function of alignment position for representative NAC proteins. Alignment position was determined from a multiple alignment of complete NAC proteins generated by ClustalX using MEGA4 softwareCitation28 followed by manual adjustments. The disorder tendency was predicted using metaPrDOS,Citation11 which integrates predictions from 5 different prediction methods. The threshold for prediction of ID is 0.5. The position of the NAC domain is shown by a green bar, while the position of the disordered transcription regulatory domain is shown by a gray bar.
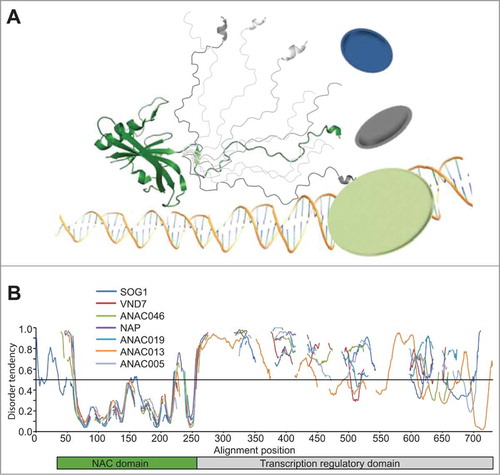
Figure 2. Phylogenetic NAC subgroups and predicted ID in NAC transcription regulatory domains. (Left) Phylogentic NAC subgroups derived from a tree generated using MEGA4 software based on a multiple alignment of complete Arabidopsis NAC proteins.Citation9 The color underlining the protein names corresponds to the color of the graphs shown at right. (Right) Predicted disorder as a function of alignment position for the transcription regulatory domains of NAC proteins from the subgroups shown. Alignment position and disorder tendency were determined as described in . The NAC domains were defined based on the multiple alignments and removed from the representation. Gaps in the resulting alignments were manually adjusted. The first amino acid residue of the transcription regulatory domain was defined as alignment position one. The approximate position of MoRFs predicted using Biomine MoRFpredCitation29 and sequence motifs identified using the MEME suite,Citation30 present in half or more of the sequences, is indicated by M or a colored bar, respectively. The letters in the bars refer to a previously identified sequence motif.Citation9 In addition, 2 novel sequence motifs, designated EF and v and having the consensus sequences E[KE][ED][DEM][YF][IL]E[MI][ND]DL and [RIT][DH]SLIP[LPQ][LTV][NV][NS], respectively, were identified in this study. The NAC proteins included in the analysis were named as previously suggested.Citation9 In addition, recently introduced acronyms refer to the following nomenclature: SMB, ANAC033, At1g79580; BRN1, ANAC015, At1g33280; BRN2, ANAC070, At4g10350; SHYG, ANAC047, At3g04070.
![Figure 2. Phylogenetic NAC subgroups and predicted ID in NAC transcription regulatory domains. (Left) Phylogentic NAC subgroups derived from a tree generated using MEGA4 software based on a multiple alignment of complete Arabidopsis NAC proteins.Citation9 The color underlining the protein names corresponds to the color of the graphs shown at right. (Right) Predicted disorder as a function of alignment position for the transcription regulatory domains of NAC proteins from the subgroups shown. Alignment position and disorder tendency were determined as described in Figure 1 . The NAC domains were defined based on the multiple alignments and removed from the representation. Gaps in the resulting alignments were manually adjusted. The first amino acid residue of the transcription regulatory domain was defined as alignment position one. The approximate position of MoRFs predicted using Biomine MoRFpredCitation29 and sequence motifs identified using the MEME suite,Citation30 present in half or more of the sequences, is indicated by M or a colored bar, respectively. The letters in the bars refer to a previously identified sequence motif.Citation9 In addition, 2 novel sequence motifs, designated EF and v and having the consensus sequences E[KE][ED][DEM][YF][IL]E[MI][ND]DL and [RIT][DH]SLIP[LPQ][LTV][NV][NS], respectively, were identified in this study. The NAC proteins included in the analysis were named as previously suggested.Citation9 In addition, recently introduced acronyms refer to the following nomenclature: SMB, ANAC033, At1g79580; BRN1, ANAC015, At1g33280; BRN2, ANAC070, At4g10350; SHYG, ANAC047, At3g04070.](/cms/asset/74914a33-0dc6-48fa-83fb-90b066a076ee/kpsb_a_1010967_f0002_oc.jpg)