Figures & data
Figure 1. BBX19 is a suppressor flowering time (A) Diagram displaying the arrangement of various genotypes. (B) Phenotypes of 30 day old Col, ceh1, BBX19 overexpression line (OE44) and OE44/ceh1. (C) Leaf number per plants to flowering time of the aforementioned genotypes. Asterisks denote a significant difference in leaf number at flowering time between control (Col) and other genotypes (P < 0.05).
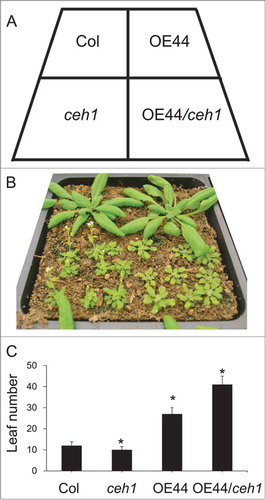
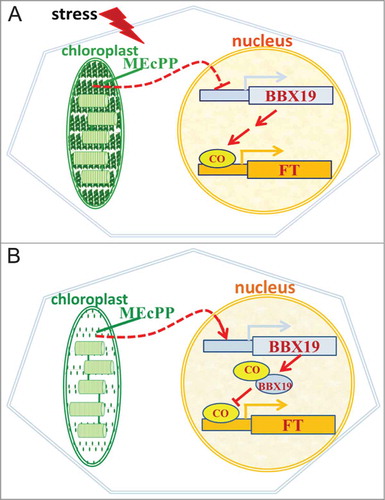
Figure 2. MEcPP levels directly or indirectly regulates flowering time by altering BBX19 transcript levels. (A) MEcPP accumulation in response to stress reduces the BBX19 transcript levels and promotes availability of CO for activation of FT. (B) Under unstressed conditions MEcPP does not accumulate hence allowing expression of BBX19 to sufficiently high levels resulting in its interaction with and depletion of CO pool required for activation of FT.