Figures & data
Figure 1. MLK1 and MLK2 interact with different motifs of RGA. Yeast two-hybrid analysis revealed an interaction between MLK1/2 and the different motifs of RGA. Different regions of RGA were indicated. The positive interactions were indicated with √, and the negative interactions were indicated with ×. Δindicated the deletion domain.
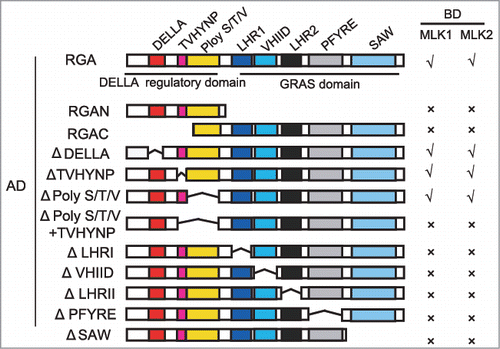
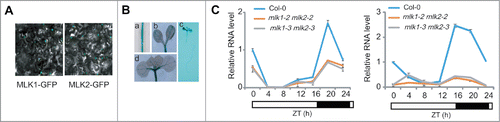
Figure 2. The subcellular localization of MLK2 and expression pattern of MLK2. A. MLK1 and MLK2 are located in nucleus. B. The expression pattern of MLK2 revealed that MLK2 expressed in vascular tissues of the roots (a, c), cotyledons (b, d), and hypocotyls (c). C. The relative transcripts of CO and FT in wild-type mlk1 mlk2 plants. RNA was isolated from the leaves of 3-week-old plants and was used to test the transcription levels of CO (left panel) and FT (right panel). The black bars indicate the dark period, and the white bars indicate the light period. Experiments were repeated at least three times, and each data point indicates the mean ± SE, n = 3 replicates. ZT, Zeitgeber time.