Figures & data
Figure 1. Shade-grown Serianthes nelsonii plants fail to maintain orthotropic stem orientation, and leaning leads to undesirable lateral bud break that reduces plant quality (yellow arrows).
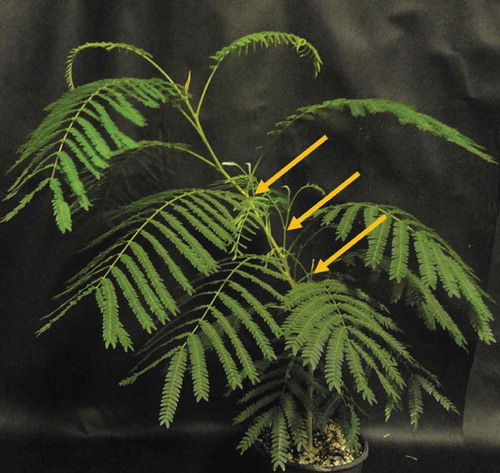
Table 1. The influence of twice-daily stem bending on morphometric traits of Serianthes nelsonii plants. Mean ± SE, n = 8.
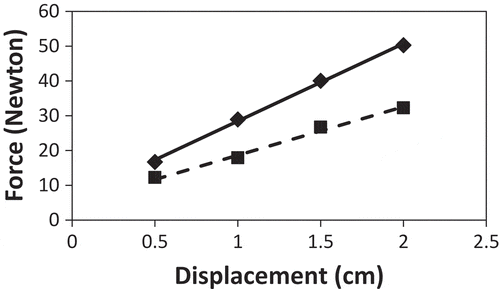
Figure 2. The force required to displace Serianthes nelsonii stems as influenced by daily bending stress. Displacement height was 20 cm above the root collar. Treated plants (diamonds and solid line): y = −1.11 + 2.61x; control plants (squares and dashed line): y = −0.48 + 1.65x. Slopes of individual replications subjected to t test: t = 34.18, P < 0.0001.
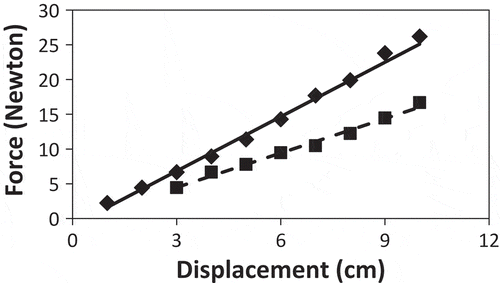
Figure 3. The force required to displace Serianthes nelsonii stems placed in a three-point test as influenced by daily bending stress. Fulcrum points were 22 cm apart, with point of force at the midpoint. Treated plants (diamonds and solid line): y = 6.17 + 22.29x; control plants (squares and dashed line): y = 4.68 + 13.95x. Slopes of individual replications subjected to t test: t = 17.17, P < 0.0001.