Figures & data
Figure 1. MKP1 is a positive regulator of stomatal development, independent of previously known ecotype-specific developmental defects.
(a) Representative confocal images of ten-day-old abaxial rosette leaf epidermis from wild-type (Col), mkp1 (Col), wild-type (Ws), and mkp1 (Ws). Both mkp1 (Col) and mkp1 (Ws) mutants exhibit similar stomatal development defects (reduction of stomata and clusters of small cells, indicated by brackets). Cells were outlined by propidium iodide staining (cyan), and images were taken under the same magnification. Scale bar = 30 µm. (b) Abaxial cotyledon stomatal index of ten-day-old seedlings, expressed as the percentage of the number of stomata to the total number of epidermal cells. n = 10 for each genotype. Bars, means. Error bars, s.e.m.**, P< .001 by Student’s t test. (c) Representative confocal images of five-week-old abaxial rosette leaf (top) and four-week-old stem epidermis (bottom) from wild-type Ws and mkp1 (Ws). Cells were outlined by propidium iodide staining (cyan), and images were taken under the same magnification. Scale bars, 50 μm.
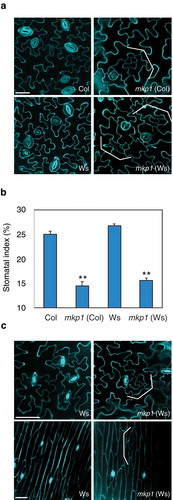
Figure 2. Transcript levels of stomata-related genes in mkp1(Col) mutants.
Ten-day-old seedlings were used for qRT-PCR analysis. Data were collected from three biological replicates, and the expression fold changes were normalized to the transcript level in wild-type (Col). Error bars represent standard deviations (n = 3). Significant difference compared with Col: *P< .01 by Student’s t test.