Figures & data
Figure 1. GFP signal detection in the cotyledonary explants at co-cultivation stage. (a) Explant with strong fluorescence signal. (b) Explant with medium fluorescence signal. (c) Explant with weak fluorescence signal. (d) Explant with none fluorescence signal. (e) Rate of different fluorescence signal intensity (%) = (the number of explants with strong, medium, weak or none fluorescence signal/total number of explants) × 100%. Results are expressed as mean ± standard error. The experiments were repeated three times with 200 explants for each replicate.
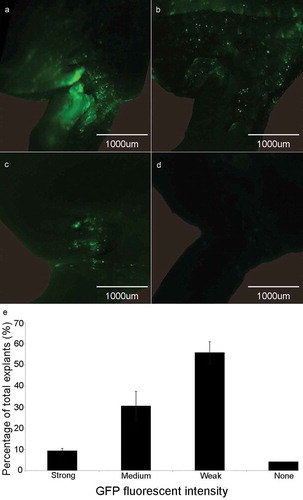
Figure 2. Detection of GFP signal in soybean explants at different stages during tissue culture and transformation efficiency. (a) Co-culture stage. (b) First shoot induction stage. (c) Initial of the second shoot induction stage. (d, e) End of the second shoot induction stage. (f, g, h, i) Shoot elongation stage. (j) Rate of positive transgenic explants at the end of shoot induction stage SI2. Rate of positive transgenic explants at SI2 (%) = (the number of positive transgenic explants at SI2/total number of explants with different GFP signal strength at CC) × 100%. (k) Transformation efficiency after transplanting. Transformation efficiency (%) = (the number of positive plants/total number of explants with different GFP signal strength at CC) × 100%. Results are expressed as mean ± standard error. The experiments were repeated three times with 200 explants for each replicate.
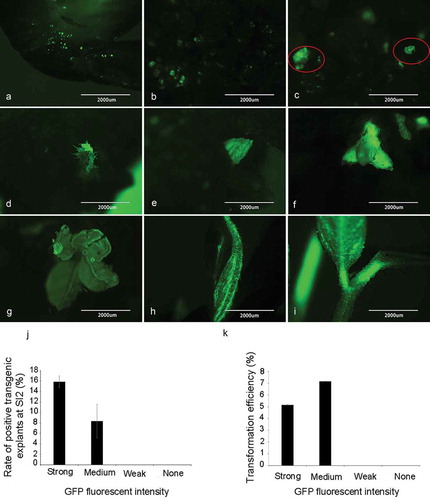
Figure 3. Comparison of the seeds from two independent transgenic soybean lines (GFP-1 and GFP-4) and control soybean plants. (a) and (b) GFP signal detection in soybean seeds under fluorescence microscope. (c) and (d) Soybean seeds under normal vision.
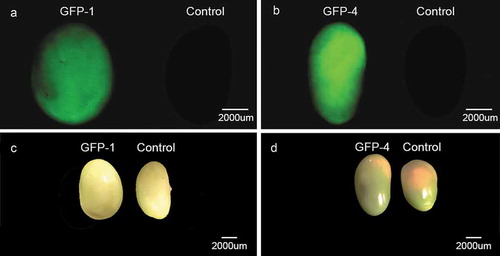
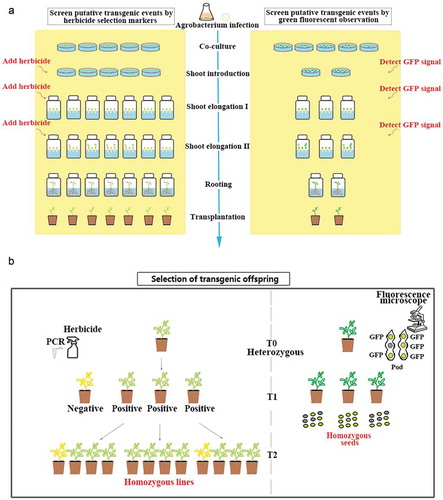
Figure 4. Comparison between herbicide and GFP selection-based methods. (a) comparison of the process to screen transgenic events. Left panel shows the process using herbicides and right panel shows the process using GFP signal to screen for positive transgenic events. (b) comparison of the process to select transgenic offspring. Left panel shows selecting homozygous lines by traditional herbicide method. Right panel shows selecting homozygous lines based on GFP signal.