Figures & data
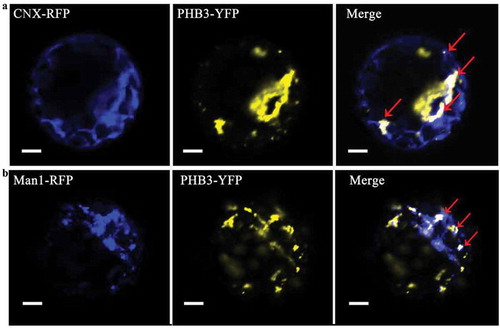
Figure 1. The Golgi and endoplasmic reticulum localization of PHB3. A, PHB3-YFP and endoplasmic reticulum marker CNX-RFP are expressed in the indicated protoplasts. The CNX-RFP signal (blue), PHB3-YFP signal (yellow), and merged photos are shown from representative samples. The red arrows indicate the co-localization in endoplasmic reticulum. Scale bar = 20 μm. B, PHB3-YFP and Golgi marker Man1-RFP are expressed in the indicated protoplasts. The Man1-RFP signal (blue), PHB3-YFP signal (yellow), and merged photos are shown from representative samples. The red arrows indicate the co-localization in Golgi. Scale bar = 20 μm.