Figures & data
Table 1. General information regarding RNA-Seq data for both reproductive and somatic cells of V. carteri under UV-B treated or control conditions.
Figure 1. (a) The number of differentially up- and down-regulated gene features between treatment (UV-B) and control (WL) groups in somatic cells. Note. N is the total number of gene features with and New represents the number of unannotated gene features; (b) Differentially expressed genes (i.e., 0–1, 1–2, & >2 log2 fold change) in somatic cells.
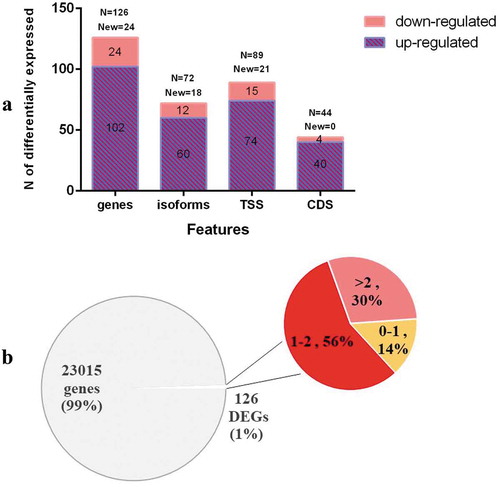
Figure 2. The volcano plot of the transcriptome in somatic cells under UV-B and WL treatment.
Note. The genes above the horizontal line are significantly based on a threshold (FDR<0.05) and the two-fold change threshold (|log2FoldChange|>1), respectively.
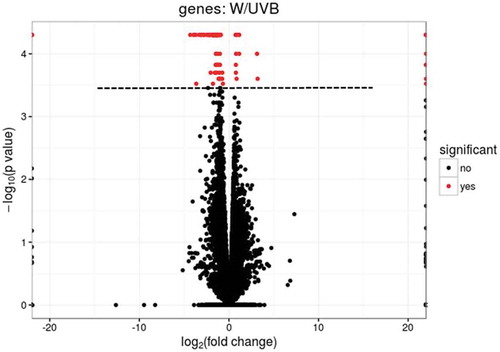
Figure 3. Heatmap (log RPKM+1) showing the expression profiles of differentially expressed genes between UV-B treated (UVB) and white light control (w) groups in somatic cells.
Note. Due to non-stranded library to generate the data, some loci included two known genes that are marked with integer number postfixes on the graph. These loci are as below:
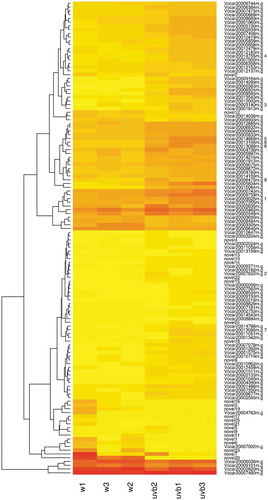
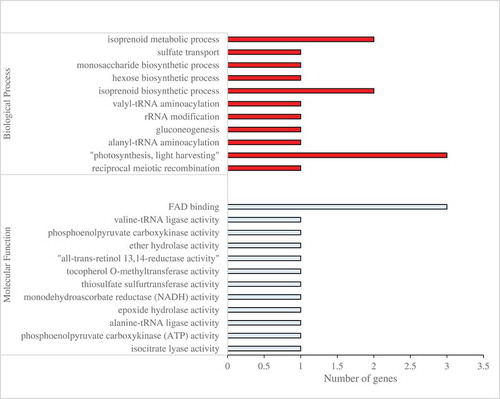
Figure 4. Functional analysis of DEGs between the UV-B treatment and control groups in the somatic cells based on gene ontology. GO category was presented for two major functional categories, namely biological process and molecular function.