
Figures & data
Figure 1. Chemical structures of three polyamines, the diamine putrescine, the triamine spermidine and the tetraamine spermine.
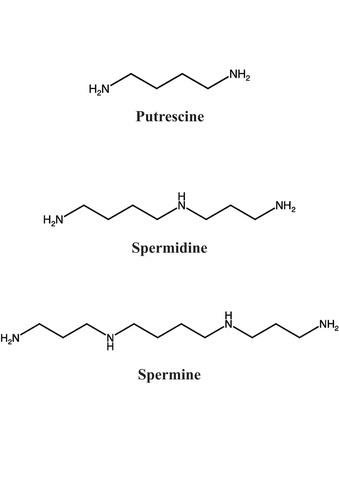
Figure 2. Extent to which polyamines alleviate the root-growth inhibition caused by MMC treatment. Panels: (a) the growth of primary roots after seedlings were transferred onto growth media with 100 µM of putrescine (Put), spermidine (Spd) or spermine (Spm) additions and the control condition (no polyamines), (b) the growth of primary roots after seedlings were transferred onto growth media with the different concentration of MMC (1, 3 and 5 µg/mL) and onto that without MMC, (c) the growth of primary roots after seedlings were transferred onto the media supplemented with 3 µg/mL MMC (MMC[+]) and polyamine hydrochloride (30 µM or 100 µM) media (Put, Spd or Spm) and a control medium without MMC [termed MMC[–]]. Error bars indicate standard deviation (n > 16). Significant differences between MMC[-] or polyamine-treated roots and their untreated roots were determined with the two-sample t-test at the P < .05 (*) level of significance. The n.s. represents no significant difference (P > .05).
![Figure 2. Extent to which polyamines alleviate the root-growth inhibition caused by MMC treatment. Panels: (a) the growth of primary roots after seedlings were transferred onto growth media with 100 µM of putrescine (Put), spermidine (Spd) or spermine (Spm) additions and the control condition (no polyamines), (b) the growth of primary roots after seedlings were transferred onto growth media with the different concentration of MMC (1, 3 and 5 µg/mL) and onto that without MMC, (c) the growth of primary roots after seedlings were transferred onto the media supplemented with 3 µg/mL MMC (MMC[+]) and polyamine hydrochloride (30 µM or 100 µM) media (Put, Spd or Spm) and a control medium without MMC [termed MMC[–]]. Error bars indicate standard deviation (n > 16). Significant differences between MMC[-] or polyamine-treated roots and their untreated roots were determined with the two-sample t-test at the P < .05 (*) level of significance. The n.s. represents no significant difference (P > .05).](/cms/asset/2d4852b3-8323-4936-ba56-3e023da8cd11/kpsb_a_1659687_f0002_oc.jpg)
Figure 3. Polyamine-dependent changes in AtBRCA1 and AtRAD51 gene expressions. Panels: (a) Relative gene expression level of AtBRCA1, (b) Relative gene expression level of AtRAD51. Expressions of AtBRCA1 and AtRAD51 were normalized using the ACT8 gene as an internal control. The values of control (Ctrl; no polyamine) with MMC[–] were set to 1.0 and other values were calculated relative to those. Error bars indicate standard deviation of biological triplicates. Significant differences between polyamine-treated seedlings and the untreated control for each series were determined with the two-sample t- test at P < .05 (*) level of significance.
![Figure 3. Polyamine-dependent changes in AtBRCA1 and AtRAD51 gene expressions. Panels: (a) Relative gene expression level of AtBRCA1, (b) Relative gene expression level of AtRAD51. Expressions of AtBRCA1 and AtRAD51 were normalized using the ACT8 gene as an internal control. The values of control (Ctrl; no polyamine) with MMC[–] were set to 1.0 and other values were calculated relative to those. Error bars indicate standard deviation of biological triplicates. Significant differences between polyamine-treated seedlings and the untreated control for each series were determined with the two-sample t- test at P < .05 (*) level of significance.](/cms/asset/8e45d944-82ab-48f5-9bff-a7d3ed25d61f/kpsb_a_1659687_f0003_oc.jpg)