2,640
Views
54
CrossRef citations to date
0
Altmetric
Research Paper

Exogenous melatonin improves seed germination in Limonium bicolor under salt stress

, , , &
Article: 1659705 | Received 14 Jul 2019, Accepted 21 Aug 2019, Published online: 28 Aug 2019

Figures & data

Figure 1. Germination of L. bicolor seeds after 7 days of treatment with various concentrations of melatonin (MT) (0 µM, 1 µM, 50 µM, 100 µM, 200 µM, 300 µM, and 500 µM) and NaCl (CK (0 mM), 100 mM, and 200 mM). A: germination rate; B: germination potential; C: germination index. Values are mean ± standard deviation of three biological replicates. Bars labeled with different letters are significantly different at P < .05 according to Duncan’s multiple range tests.
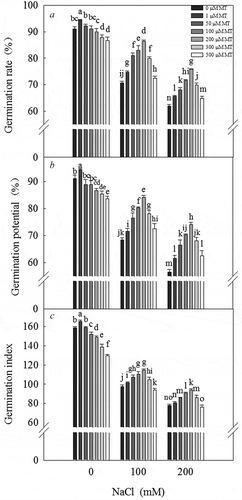
Figure 1. Germination of L. bicolor seeds after 7 days of treatment with various concentrations of melatonin (MT) (0 µM, 1 µM, 50 µM, 100 µM, 200 µM, 300 µM, and 500 µM) and NaCl (CK (0 mM), 100 mM, and 200 mM). A: germination rate; B: germination potential; C: germination index. Values are mean ± standard deviation of three biological replicates. Bars labeled with different letters are significantly different at P < .05 according to Duncan’s multiple range tests.
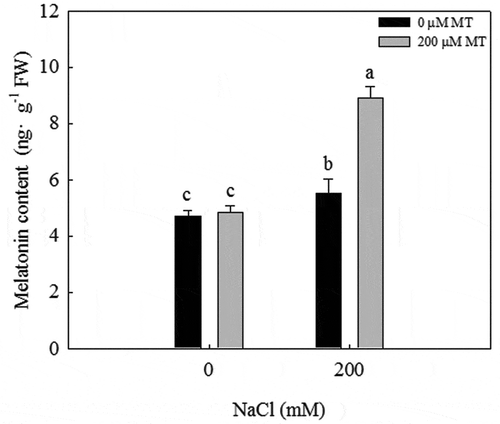
Figure 2. Melatonin concentration of L. bicolor seeds after two days of treatment with different concentrations of melatonin (MT) (0 µM, 200 µM) under 0 and 200 mM NaCl conditions. Values are mean ± standard deviation of three biological replicates. Bars labeled with different letters are significantly different at P < .05 according to Duncan’s multiple range tests.
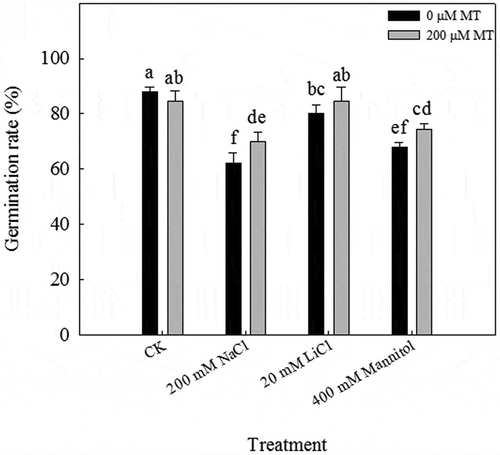
Figure 2. Melatonin concentration of L. bicolor seeds after two days of treatment with different concentrations of melatonin (MT) (0 µM, 200 µM) under 0 and 200 mM NaCl conditions. Values are mean ± standard deviation of three biological replicates. Bars labeled with different letters are significantly different at P < .05 according to Duncan’s multiple range tests.
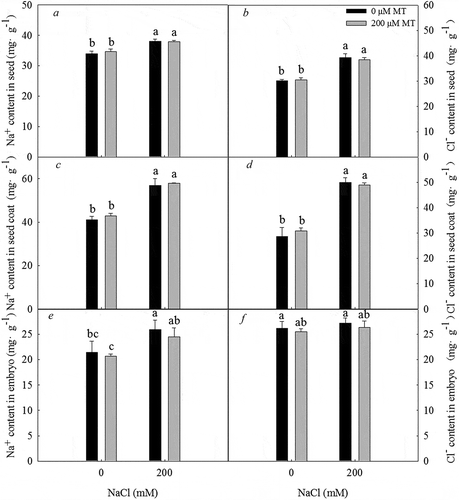
Figure 3. Germination rates of L. bicolor seeds after 7 days of treatment with CK, 200 mM NaCl, 20 mM LiCl, and 400 mM mannitol after pre-treatment with 0 and 200 µM melatonin (MT). Values are mean ± standard deviation of three biological replicates. Bars labeled with different letters are significantly different at P < .05 according to Duncan’s multiple range tests.
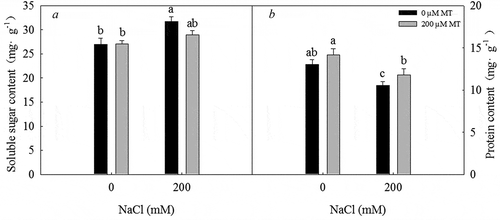
Figure 3. Germination rates of L. bicolor seeds after 7 days of treatment with CK, 200 mM NaCl, 20 mM LiCl, and 400 mM mannitol after pre-treatment with 0 and 200 µM melatonin (MT). Values are mean ± standard deviation of three biological replicates. Bars labeled with different letters are significantly different at P < .05 according to Duncan’s multiple range tests.
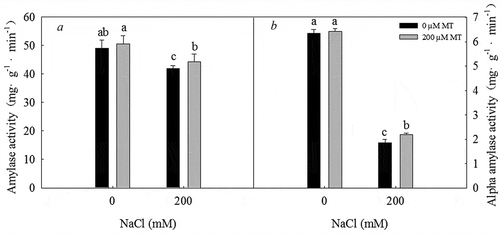
Figure 4. Na+ and Cl concentration in seeds, seed coats, and embryos of L. bicolor after 2 days of treatment with different concentrations of melatonin (MT) (0 µM, 200 µM) under 0 and 200 mM NaCl conditions. A: Na+ concentration in seeds; B: Cl concentration in seeds; C: Na+ concentration in seed coats; D: Cl concentration in seed coats; E: Na+ concentration in embryos; F: Cl concentration in embryos. Values are mean ± standard deviation of three biological replicates. Bars labeled with different letters are significantly different at P < .05 according to Duncan’s multiple range tests.
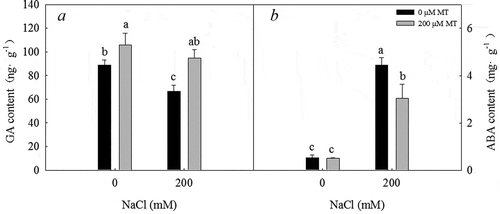
Figure 4. Na+ and Cl – concentration in seeds, seed coats, and embryos of L. bicolor after 2 days of treatment with different concentrations of melatonin (MT) (0 µM, 200 µM) under 0 and 200 mM NaCl conditions. A: Na+ concentration in seeds; B: Cl – concentration in seeds; C: Na+ concentration in seed coats; D: Cl – concentration in seed coats; E: Na+ concentration in embryos; F: Cl – concentration in embryos. Values are mean ± standard deviation of three biological replicates. Bars labeled with different letters are significantly different at P < .05 according to Duncan’s multiple range tests.
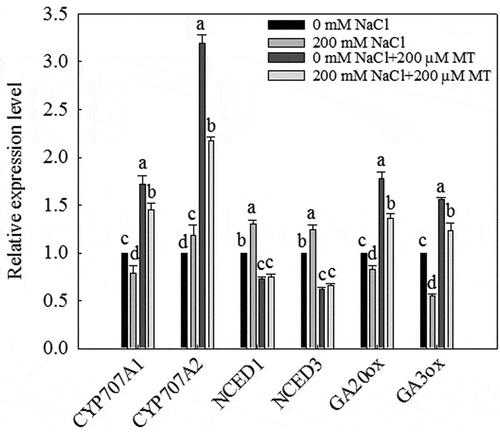
Figure 5. Soluble sugar concentration and total protein concentration in L. bicolor seeds after 2 days of treatment with different concentrations of melatonin (MT) (0 µM, 200 µM) under 0 and 200 mM NaCl conditions. A: soluble sugar concentration; B: total protein concentration. Values are mean ± standard deviation of three biological replicates. Bars with different letters are significantly different at P < .05 according to Duncan’s multiple range tests.

Figure 5. Soluble sugar concentration and total protein concentration in L. bicolor seeds after 2 days of treatment with different concentrations of melatonin (MT) (0 µM, 200 µM) under 0 and 200 mM NaCl conditions. A: soluble sugar concentration; B: total protein concentration. Values are mean ± standard deviation of three biological replicates. Bars with different letters are significantly different at P < .05 according to Duncan’s multiple range tests.

Figure 6. Amylase and α-amylase activity in L. bicolor seeds after 1 day of treatment with different concentrations of melatonin (MT) (0 µM, 200 µM) under 0 and 200 mM NaCl conditions. A: amylase activity; B: α-amylase activity. Values are mean ± standard deviation of three biological replicates. Bars with different letters are significantly different at P < .05 according to Duncan’s multiple range tests.

Figure 6. Amylase and α-amylase activity in L. bicolor seeds after 1 day of treatment with different concentrations of melatonin (MT) (0 µM, 200 µM) under 0 and 200 mM NaCl conditions. A: amylase activity; B: α-amylase activity. Values are mean ± standard deviation of three biological replicates. Bars with different letters are significantly different at P < .05 according to Duncan’s multiple range tests.

Figure 7. GA and ABA concentrations in L. bicolor seeds after 2 days of treatment with different concentrations of melatonin (MT) (0 µM, 200 µM) under 0 and 200 mM NaCl conditions. A: GA concentration; B: ABA concentration. Values are mean ± standard deviation of three biological replicates. Bars with different letters are significantly different at P < .05 according to Duncan’s multiple range tests.

Figure 7. GA and ABA concentrations in L. bicolor seeds after 2 days of treatment with different concentrations of melatonin (MT) (0 µM, 200 µM) under 0 and 200 mM NaCl conditions. A: GA concentration; B: ABA concentration. Values are mean ± standard deviation of three biological replicates. Bars with different letters are significantly different at P < .05 according to Duncan’s multiple range tests.

Figure 8. Effects of 200 µM melatonin on the transcript levels of key GA biosynthesis, ABA biosynthesis, and hydroxylase genes during L. bicolor seed germination under NaCl stress. Tubulin was used as an internal standard. Values are mean ± standard deviation of three biological replicates. Bars with different letters are significantly different at P < .05 according to Duncan’s multiple range tests.

Figure 8. Effects of 200 µM melatonin on the transcript levels of key GA biosynthesis, ABA biosynthesis, and hydroxylase genes during L. bicolor seed germination under NaCl stress. Tubulin was used as an internal standard. Values are mean ± standard deviation of three biological replicates. Bars with different letters are significantly different at P < .05 according to Duncan’s multiple range tests.
Supplemental material

Supplemental Material

Download MS Word (16.5 KB)

Reprints and Corporate Permissions

Please note: Selecting permissions does not provide access to the full text of the article, please see our help page How do I view content?

To request a reprint or corporate permissions for this article, please click on the relevant link below:

Academic Permissions

Please note: Selecting permissions does not provide access to the full text of the article, please see our help page How do I view content?

Obtain permissions instantly via Rightslink by clicking on the button below:

If you are unable to obtain permissions via Rightslink, please complete and submit this Permissions form. For more information, please visit our Permissions help page.